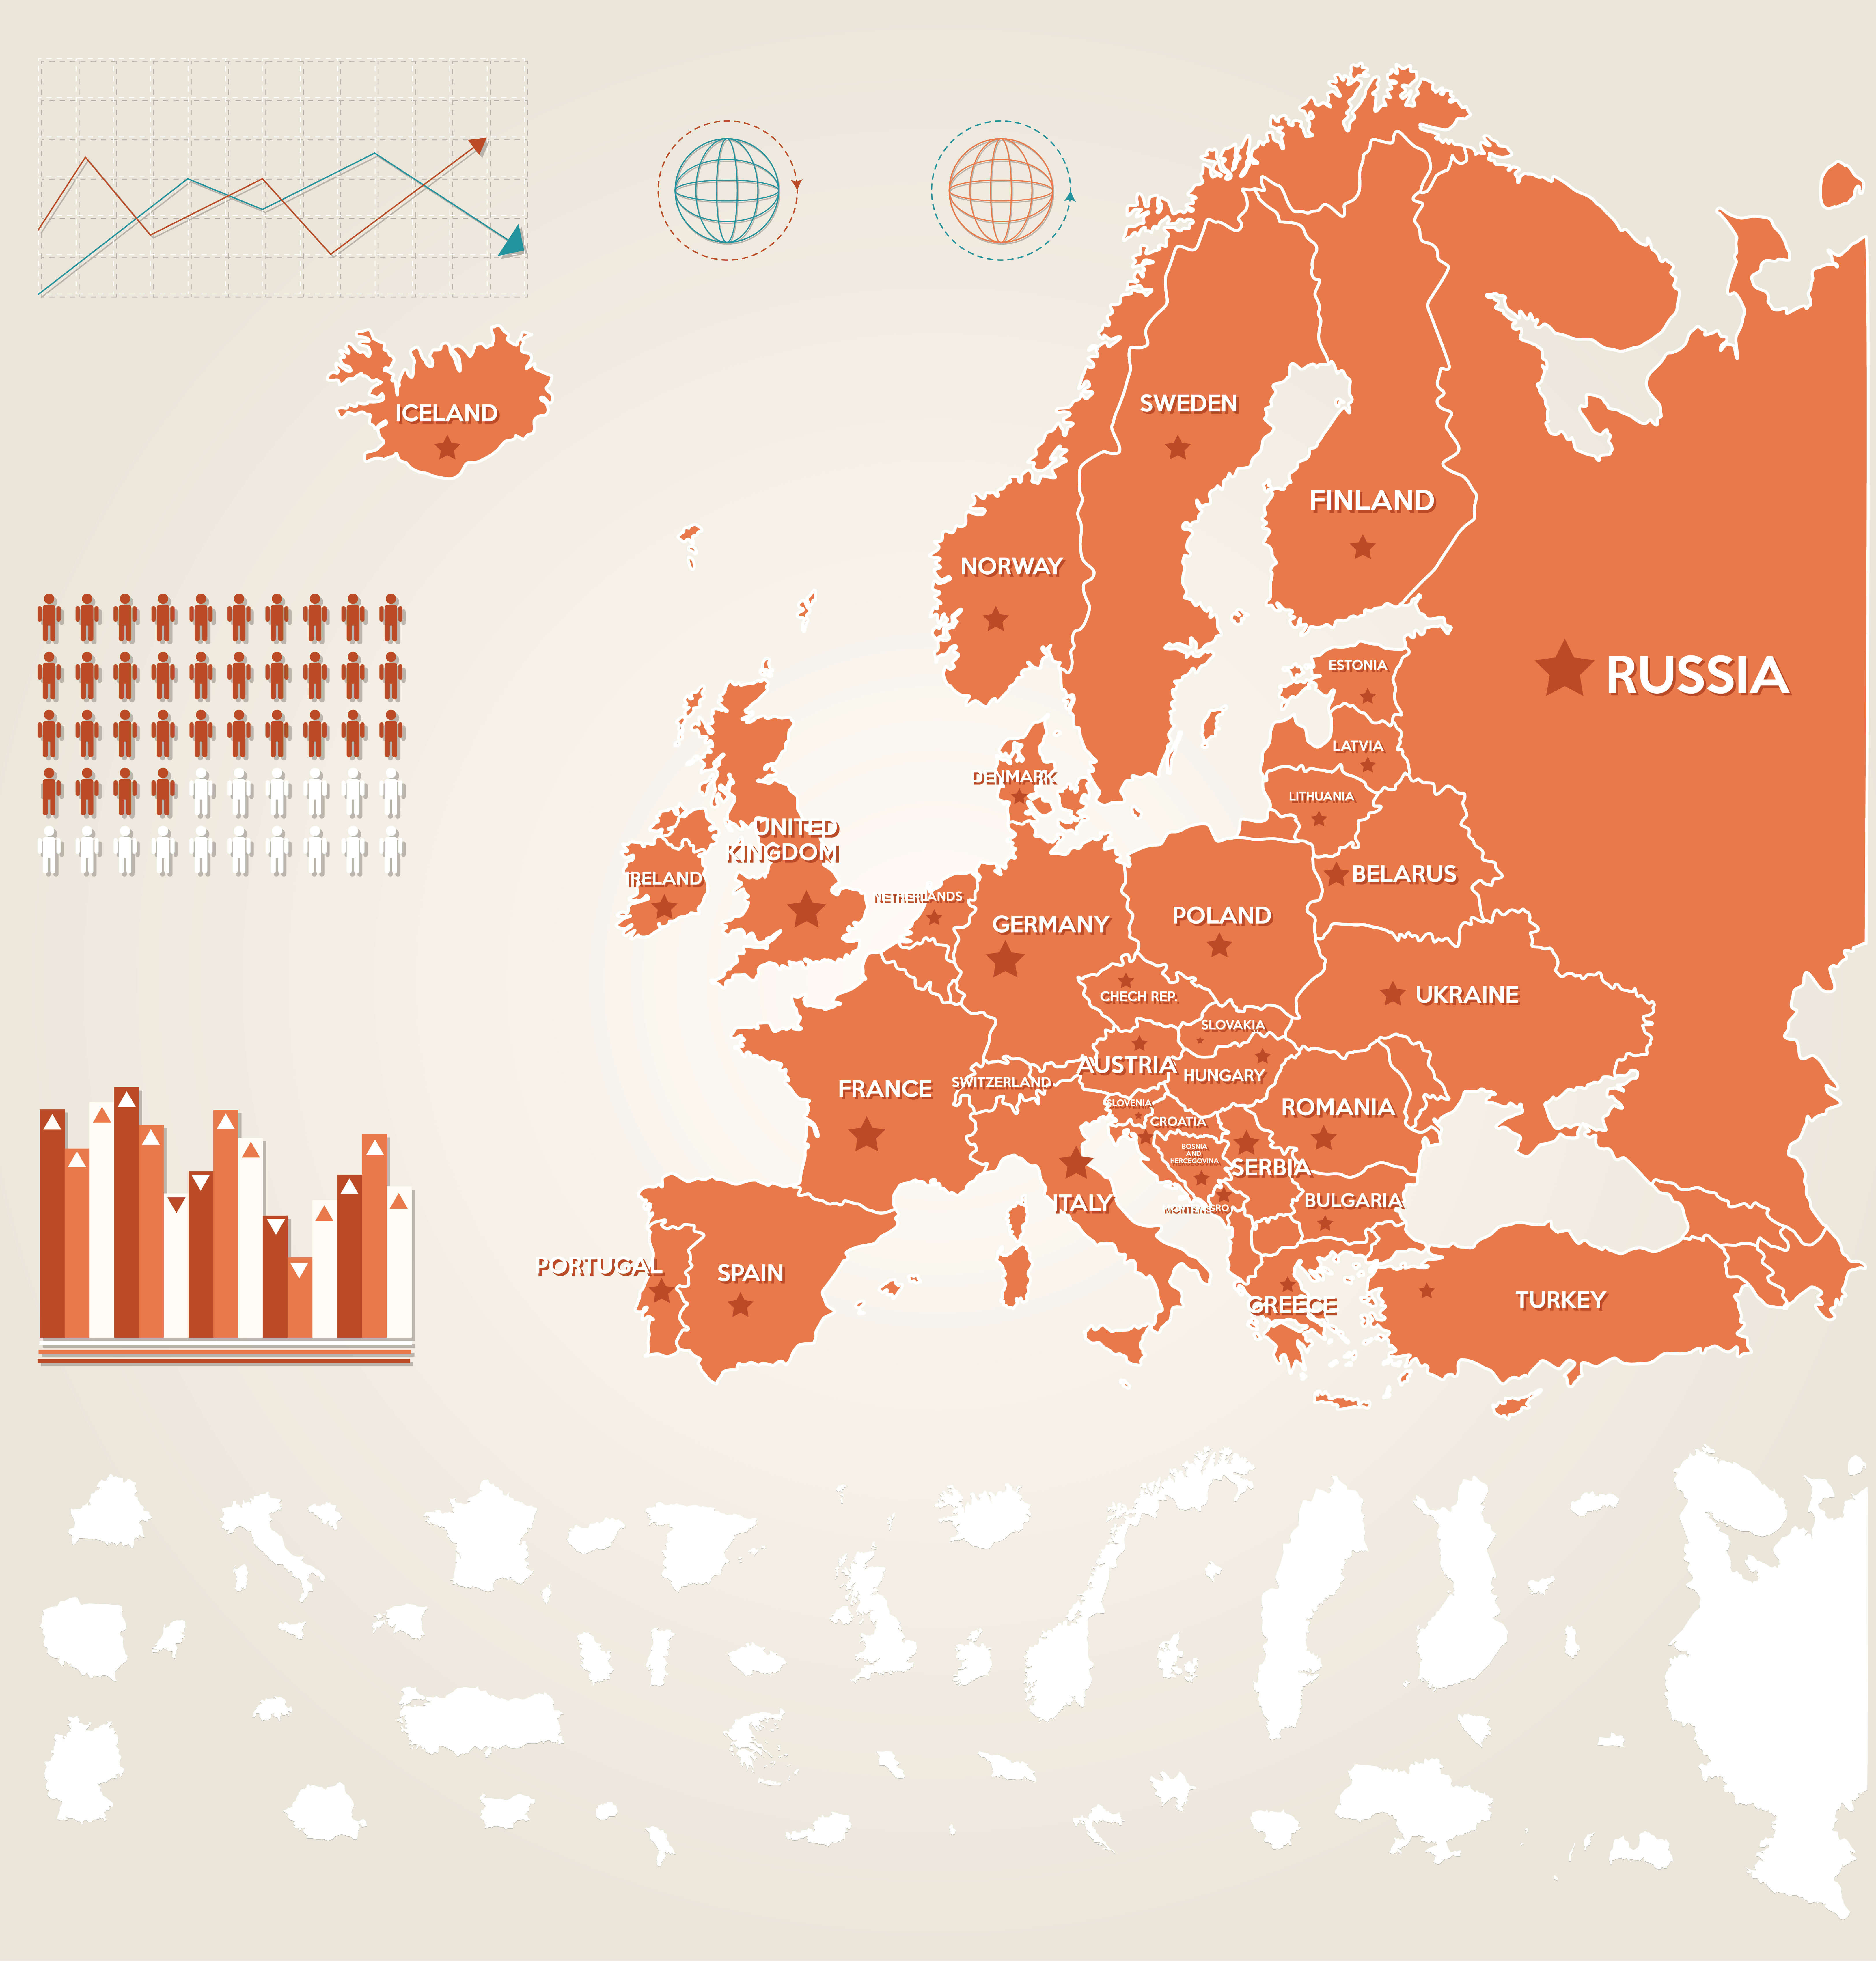
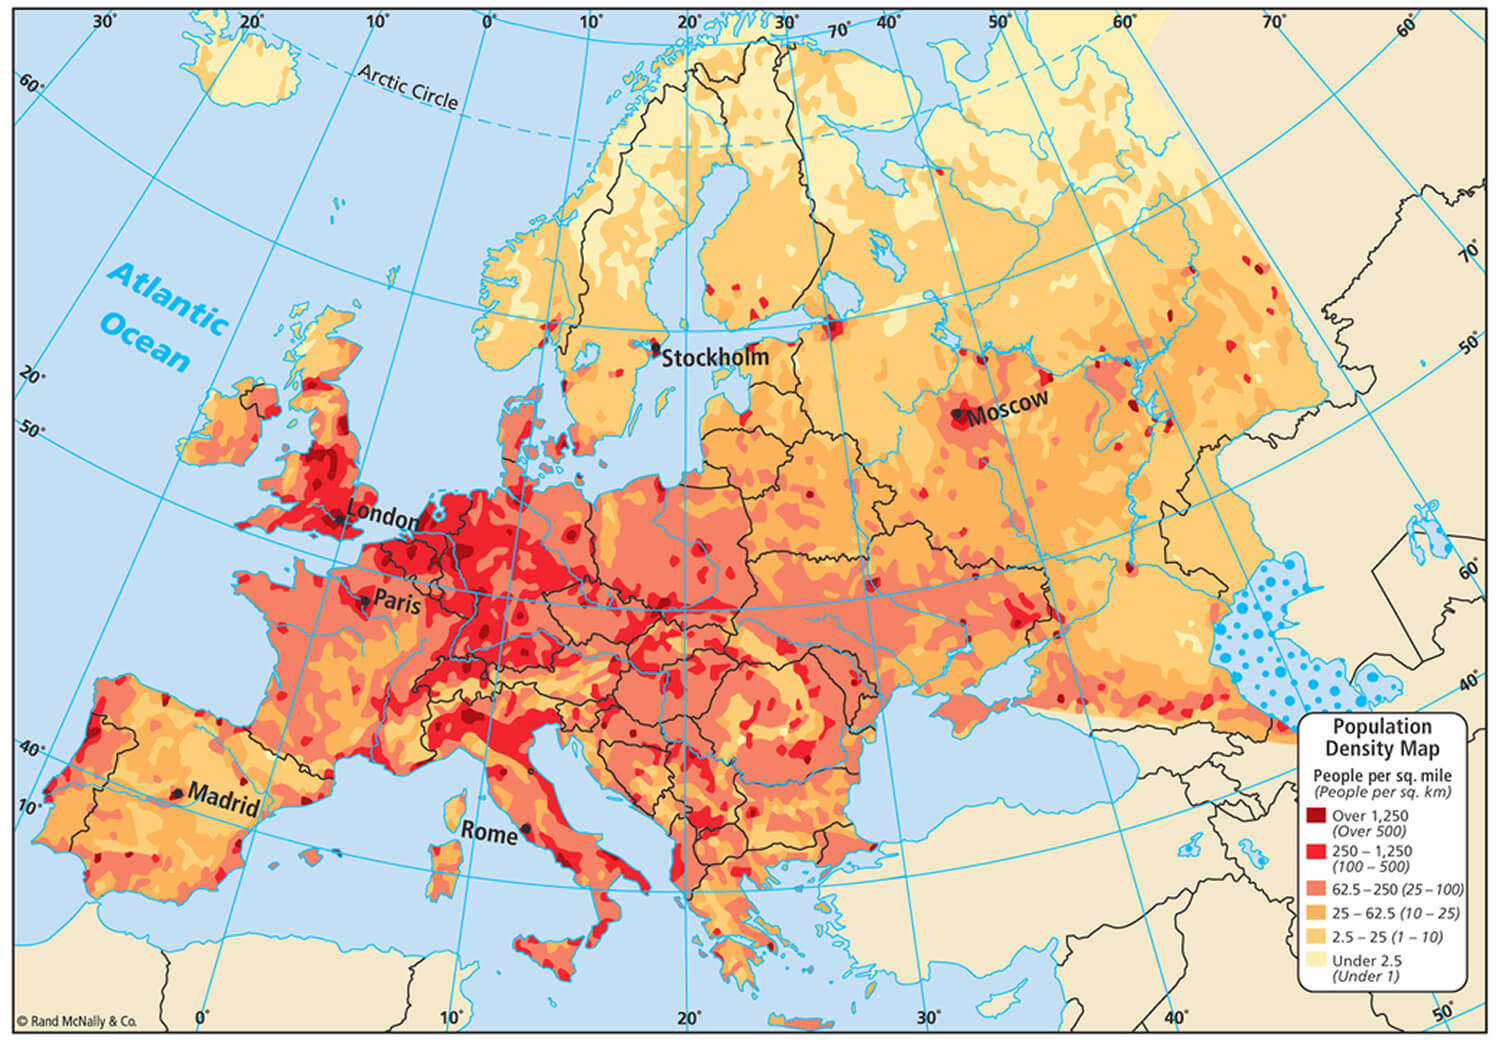
Population Density Map of Europe - Regional Overview
 Map showing population density across Europe with areas grouped by inhabitants per km².
This map illustrates the population density across Europe, categorizing regions according to the number of inhabitants per square kilometer. Major urban centers like London, Paris, and Moscow stand out as densely populated clusters, while rural and less populated areas are distinctly highlighted, offering a clear depiction of the demographic distribution.
Population Growth Map of Europe in 2021
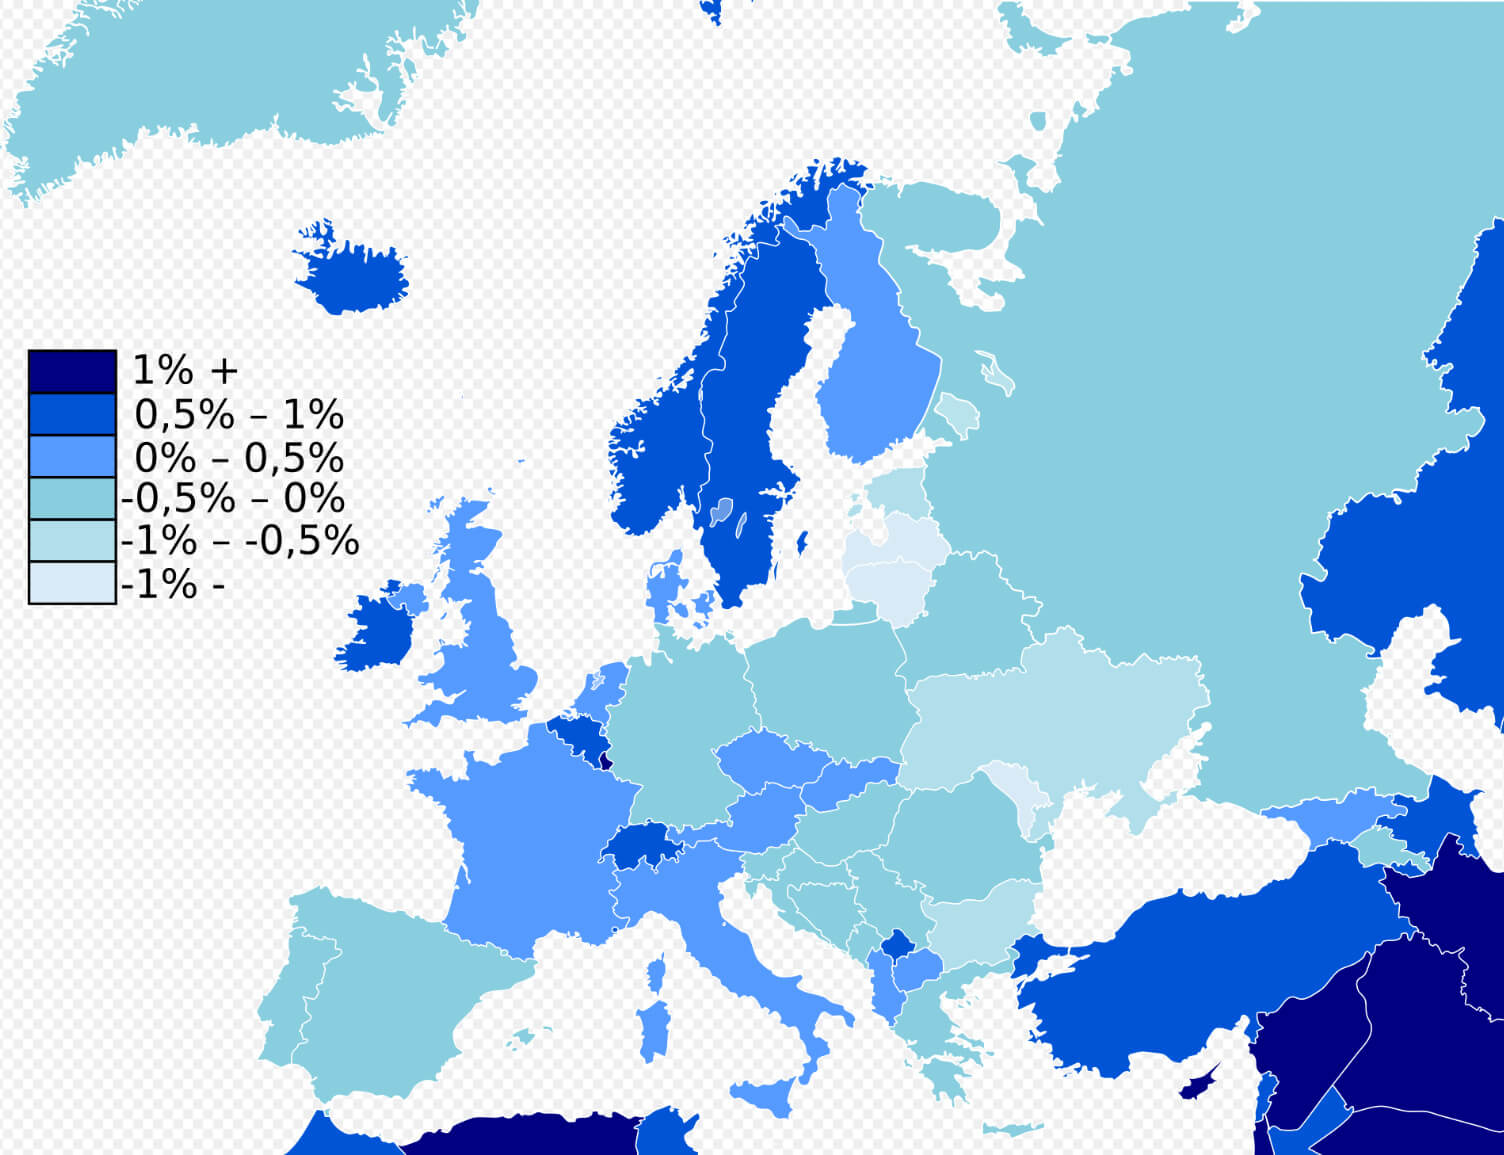 Map of Europe showing population growth rates by country in 2021.
This map depicts population growth rates across Europe for 2021, segmented into percentage ranges. Regions shaded in dark blue represent areas with high growth, while lighter shades indicate slower growth or population decline. It effectively highlights key demographic trends, revealing areas experiencing notable shifts in population dynamics.
Europe Population Map (2016)
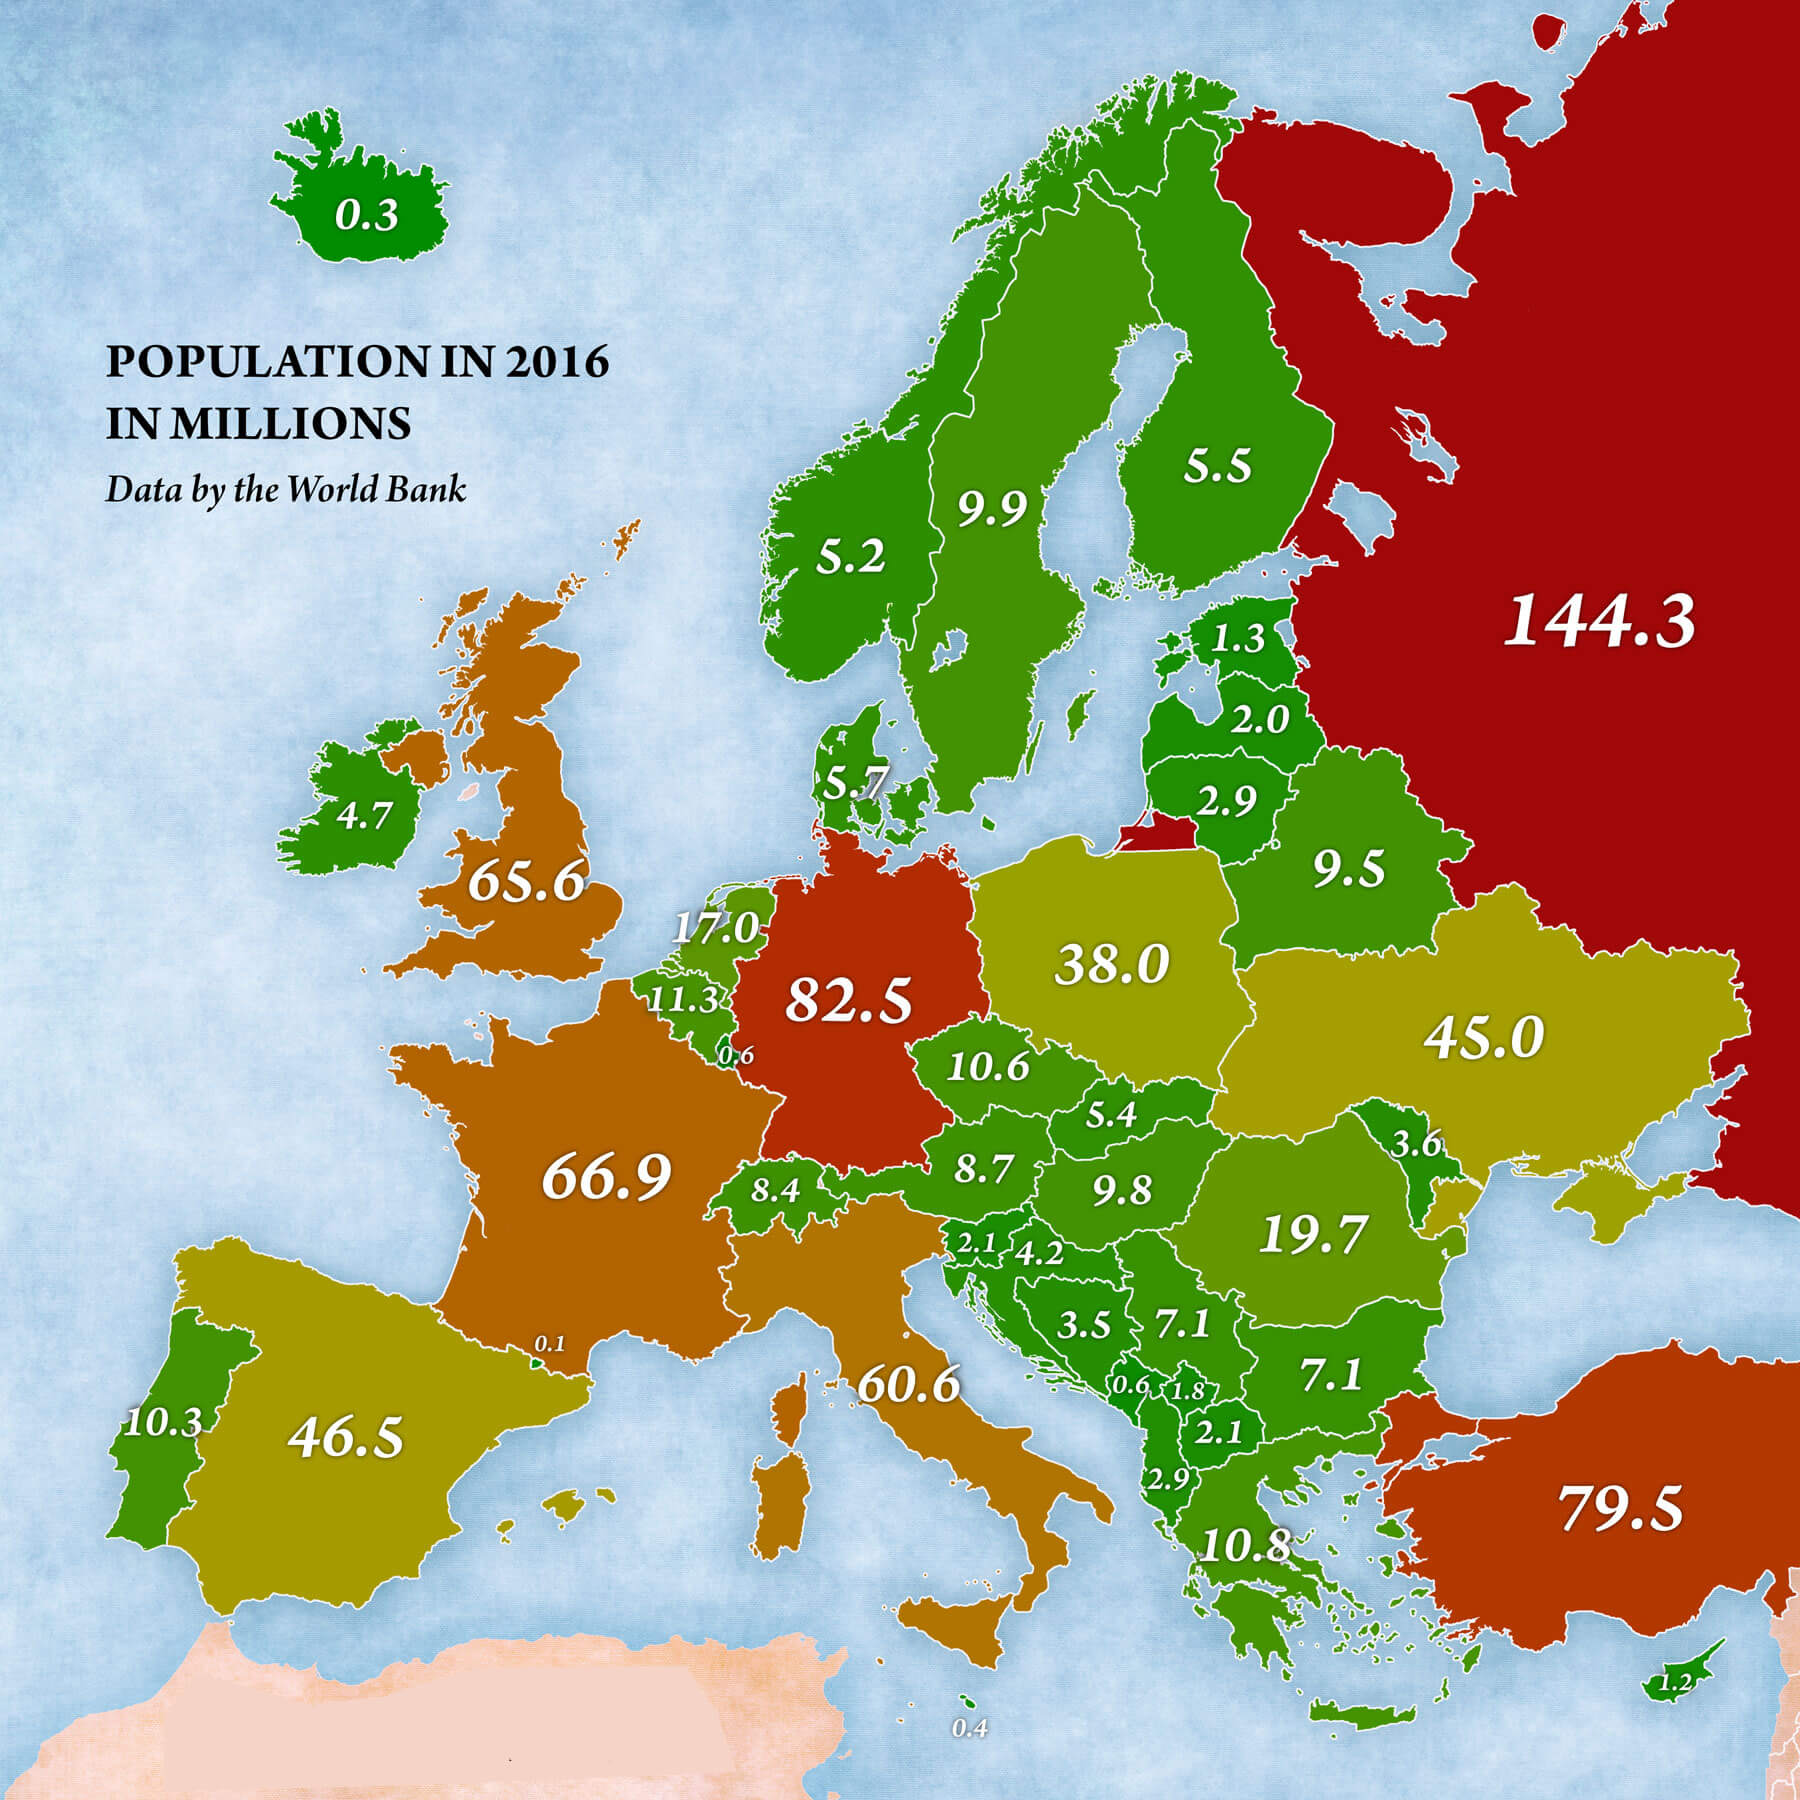 Map of Europe showing population by country in millions, based on 2016 World Bank data.
This map displays the population of European countries in 2016, measured in millions. Germany tops the list with 82.5 million inhabitants, followed by Russia with 144.3 million. In contrast, smaller nations like Iceland have a population of only 0.3 million, underscoring the remarkable demographic diversity across Europe.
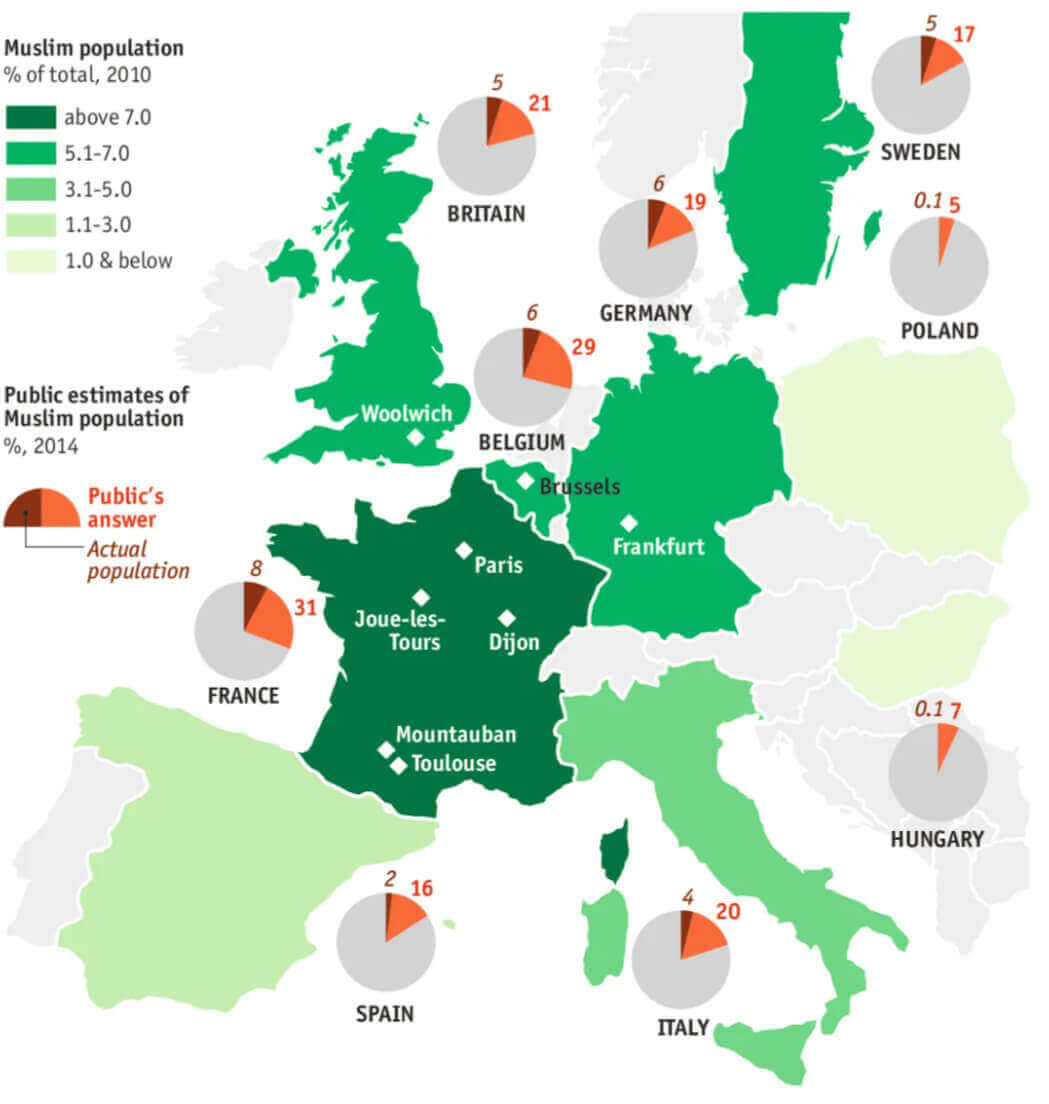
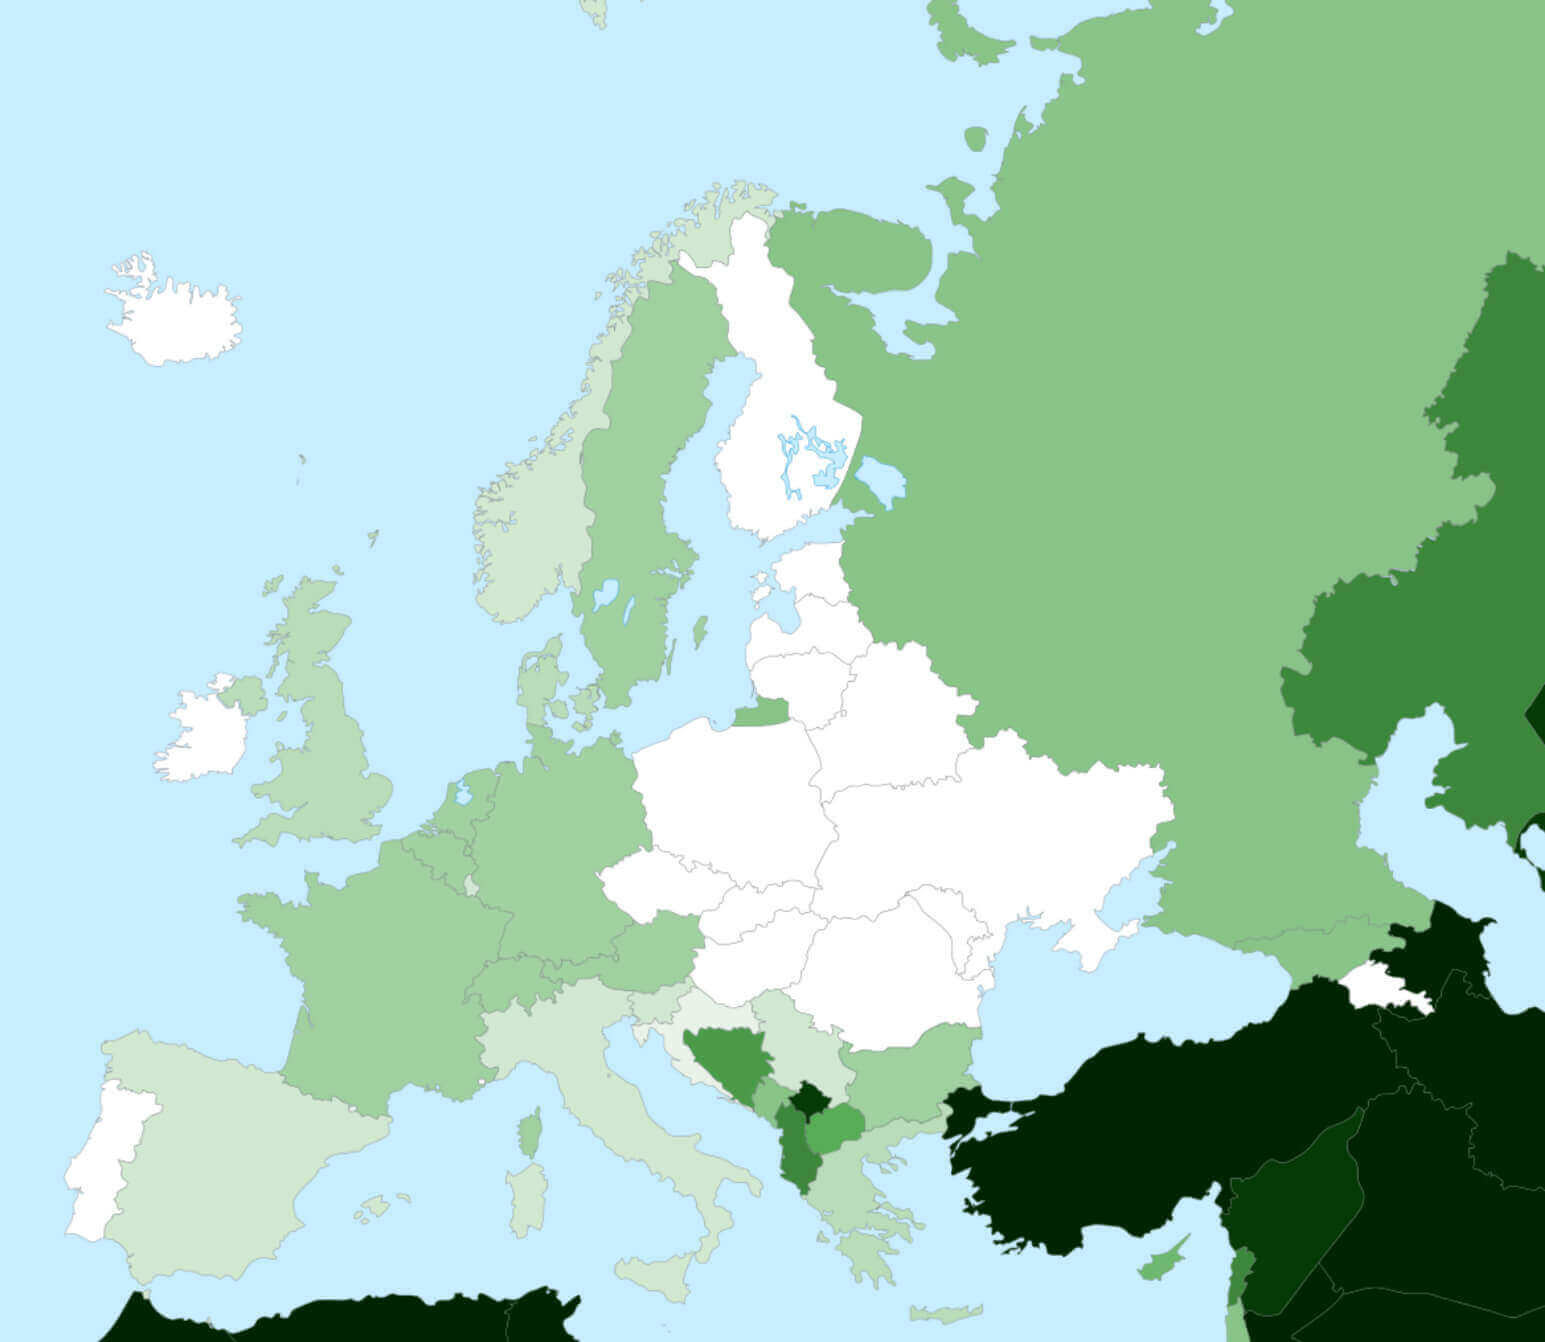
Europe's Muslim Population in 2010: A Regional Overview
 Map of Europe showing Muslim population distribution in 2010, categorized by percentage
This map depicts the proportion of Muslims in each European country in 2010, with regions color-coded according to their Muslim population share. Pie charts are used to compare public estimates with actual population data in selected countries, revealing notable discrepancies between perception and reality.
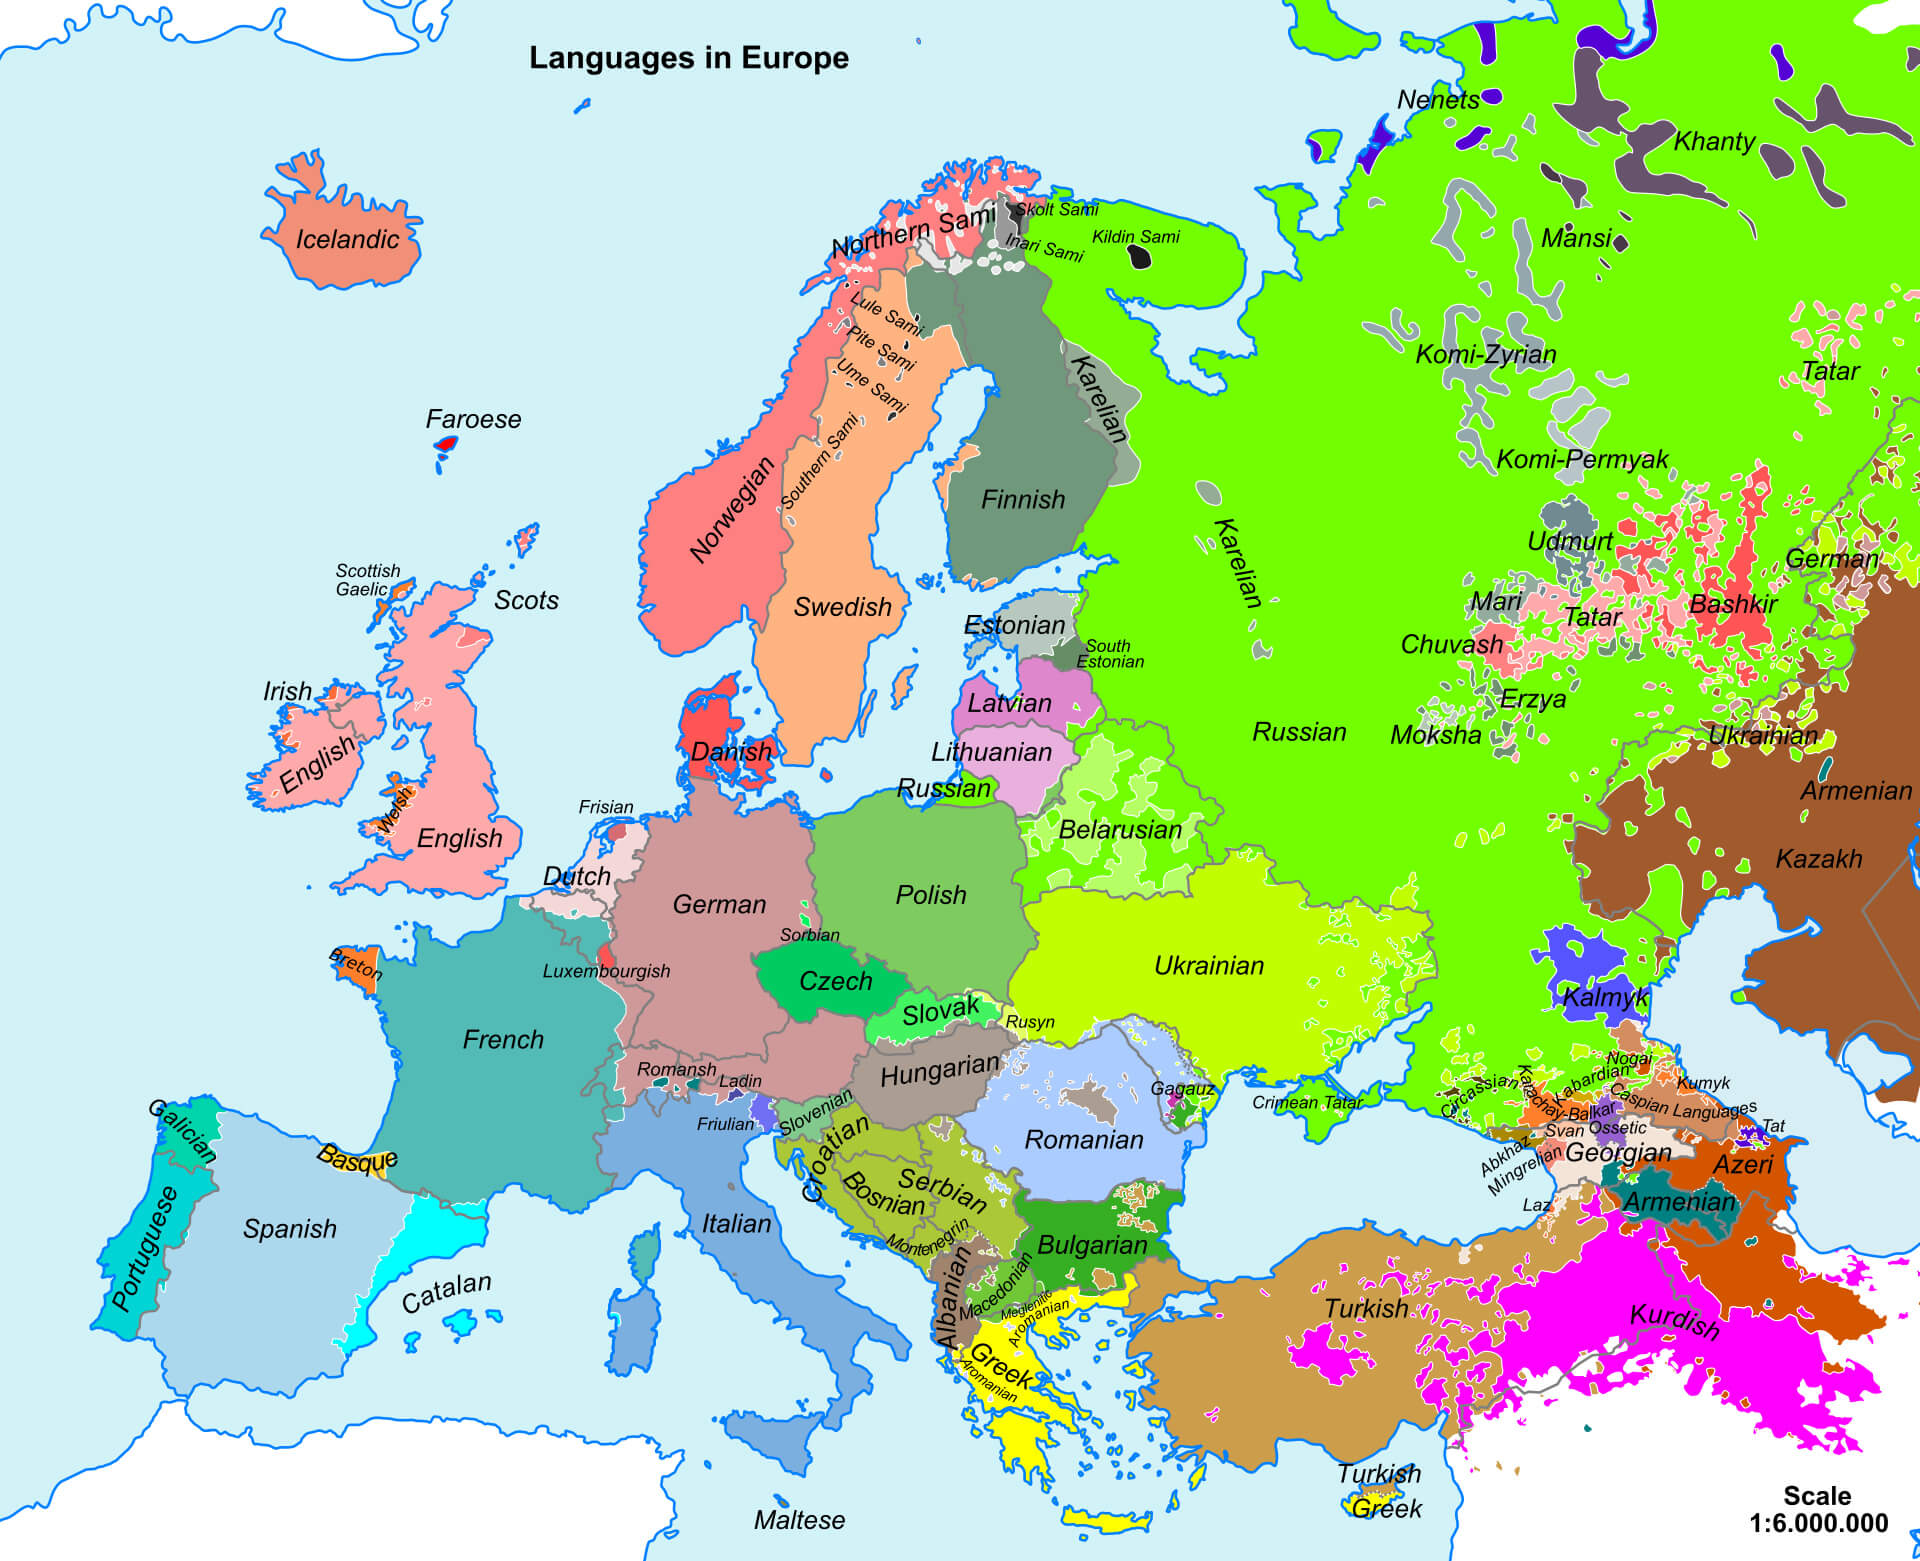
Major Languages of Europe - Regional Map
 Map showing the major languages spoken across Europe with regional distinctions.
This map emphasizes the distribution of major languages spoken across Europe, such as English, French, German, and Russian, alongside regional languages like Basque and Sami. It provides a visual representation of linguistic diversity, illustrating how languages are either widely shared or concentrated in specific regions throughout the continent.
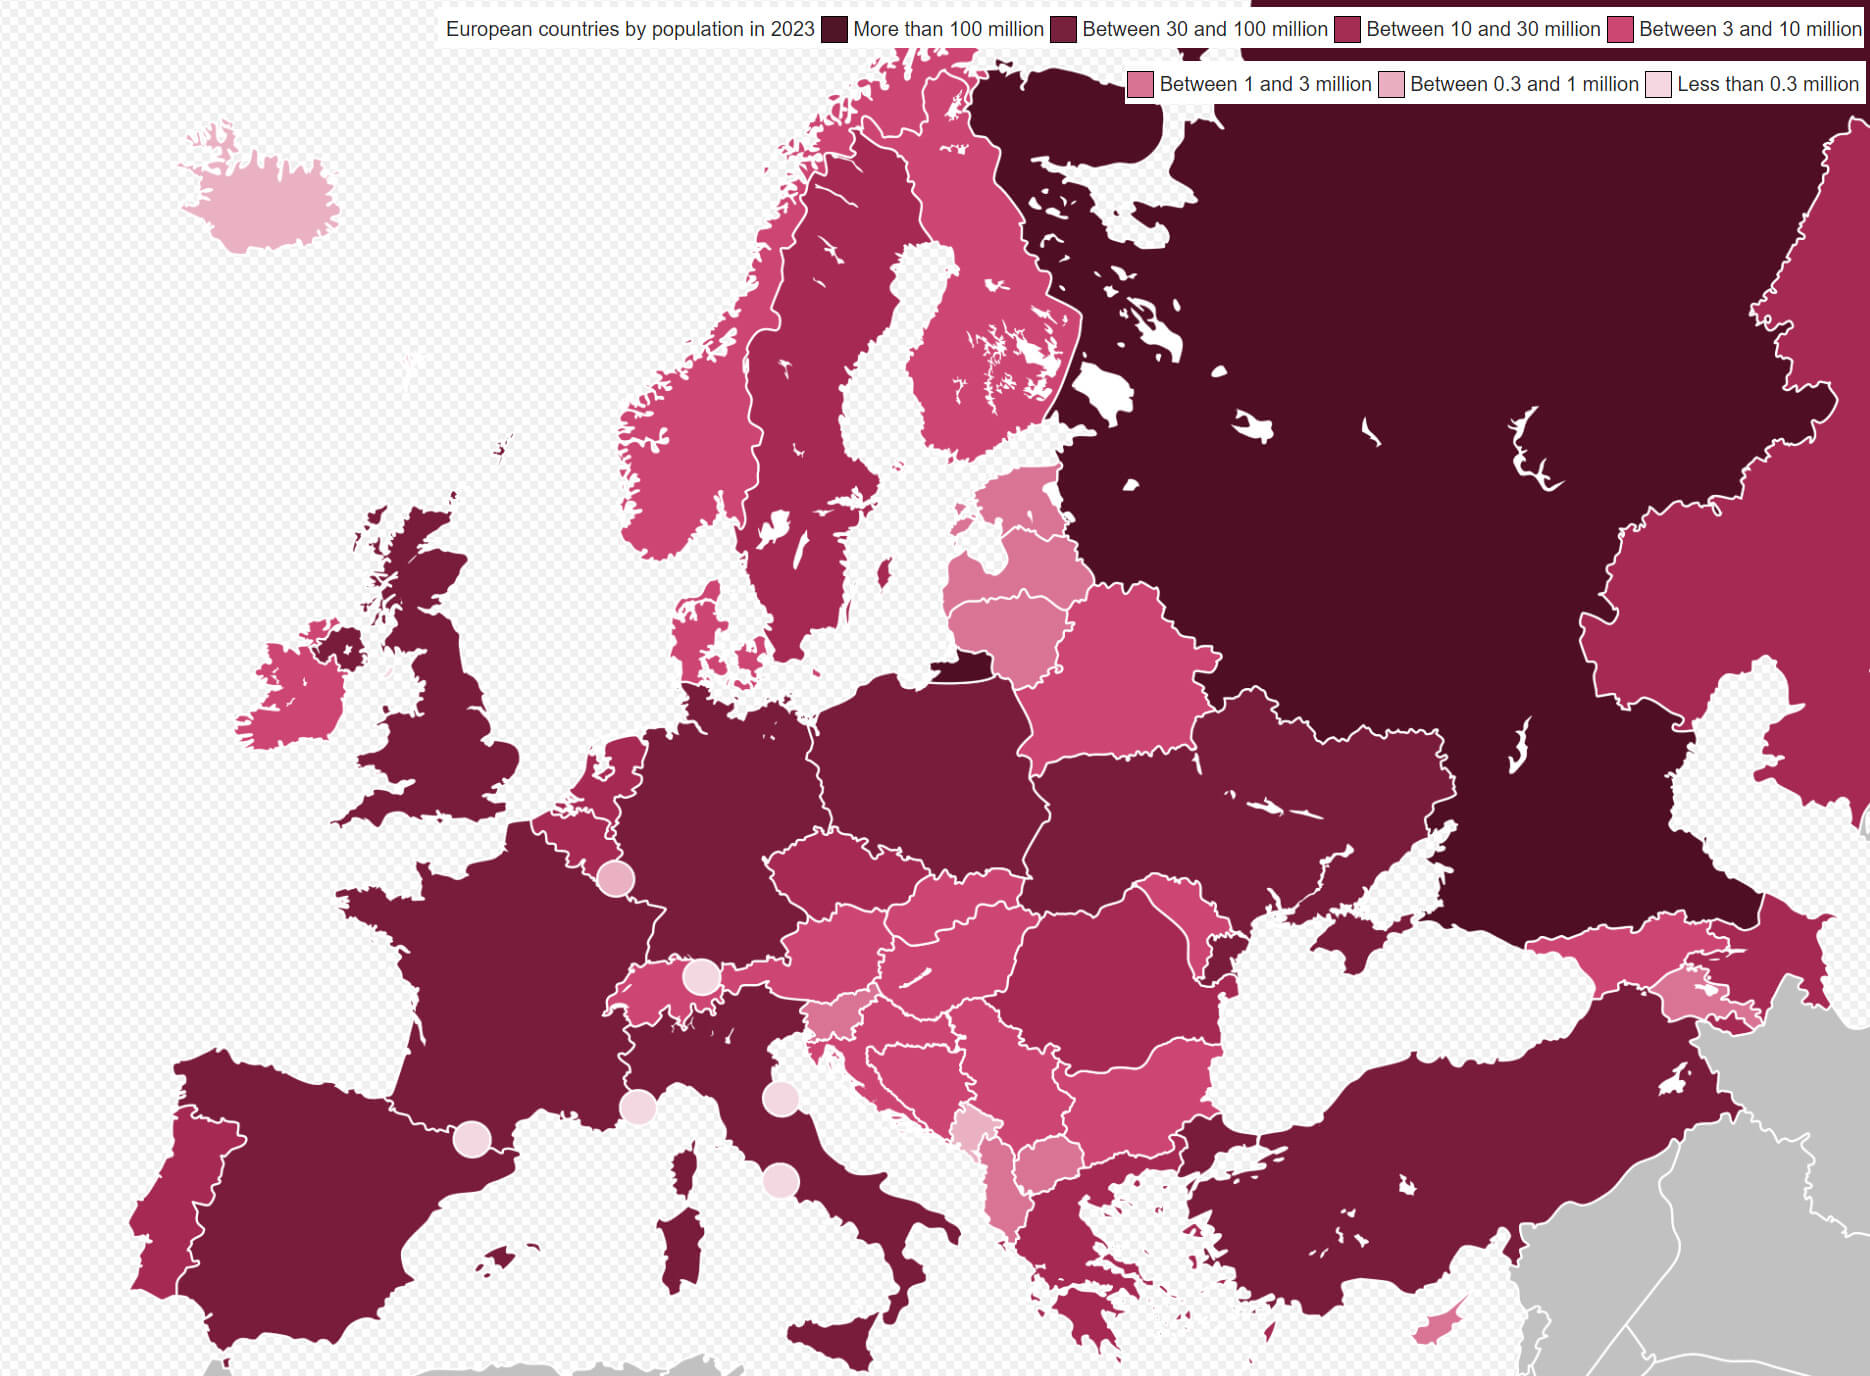
European countries by population map in 2023
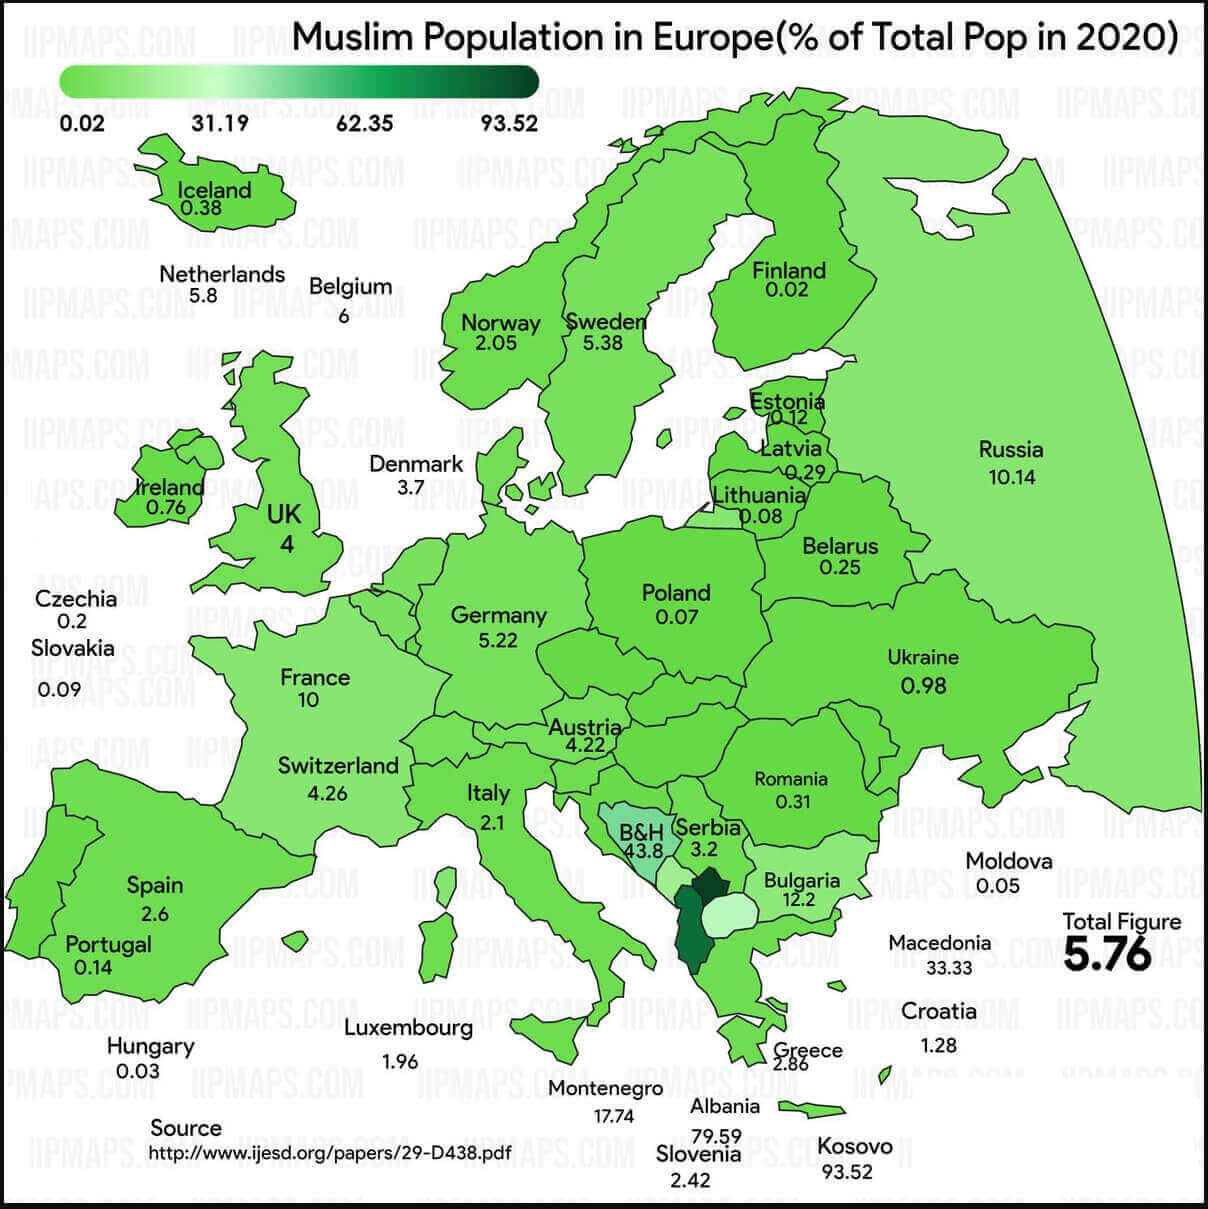
Muslim Population Across European Countries in 2020
 Map showing Muslim population percentage in European countries in 2020
This map shows the Muslim population as a percentage of the total population of European countries in 2020. Countries are shaded to reflect different Muslim population densities, highlighting differences across the region, with an overall figure of 5.76%.
Europe muslim population map
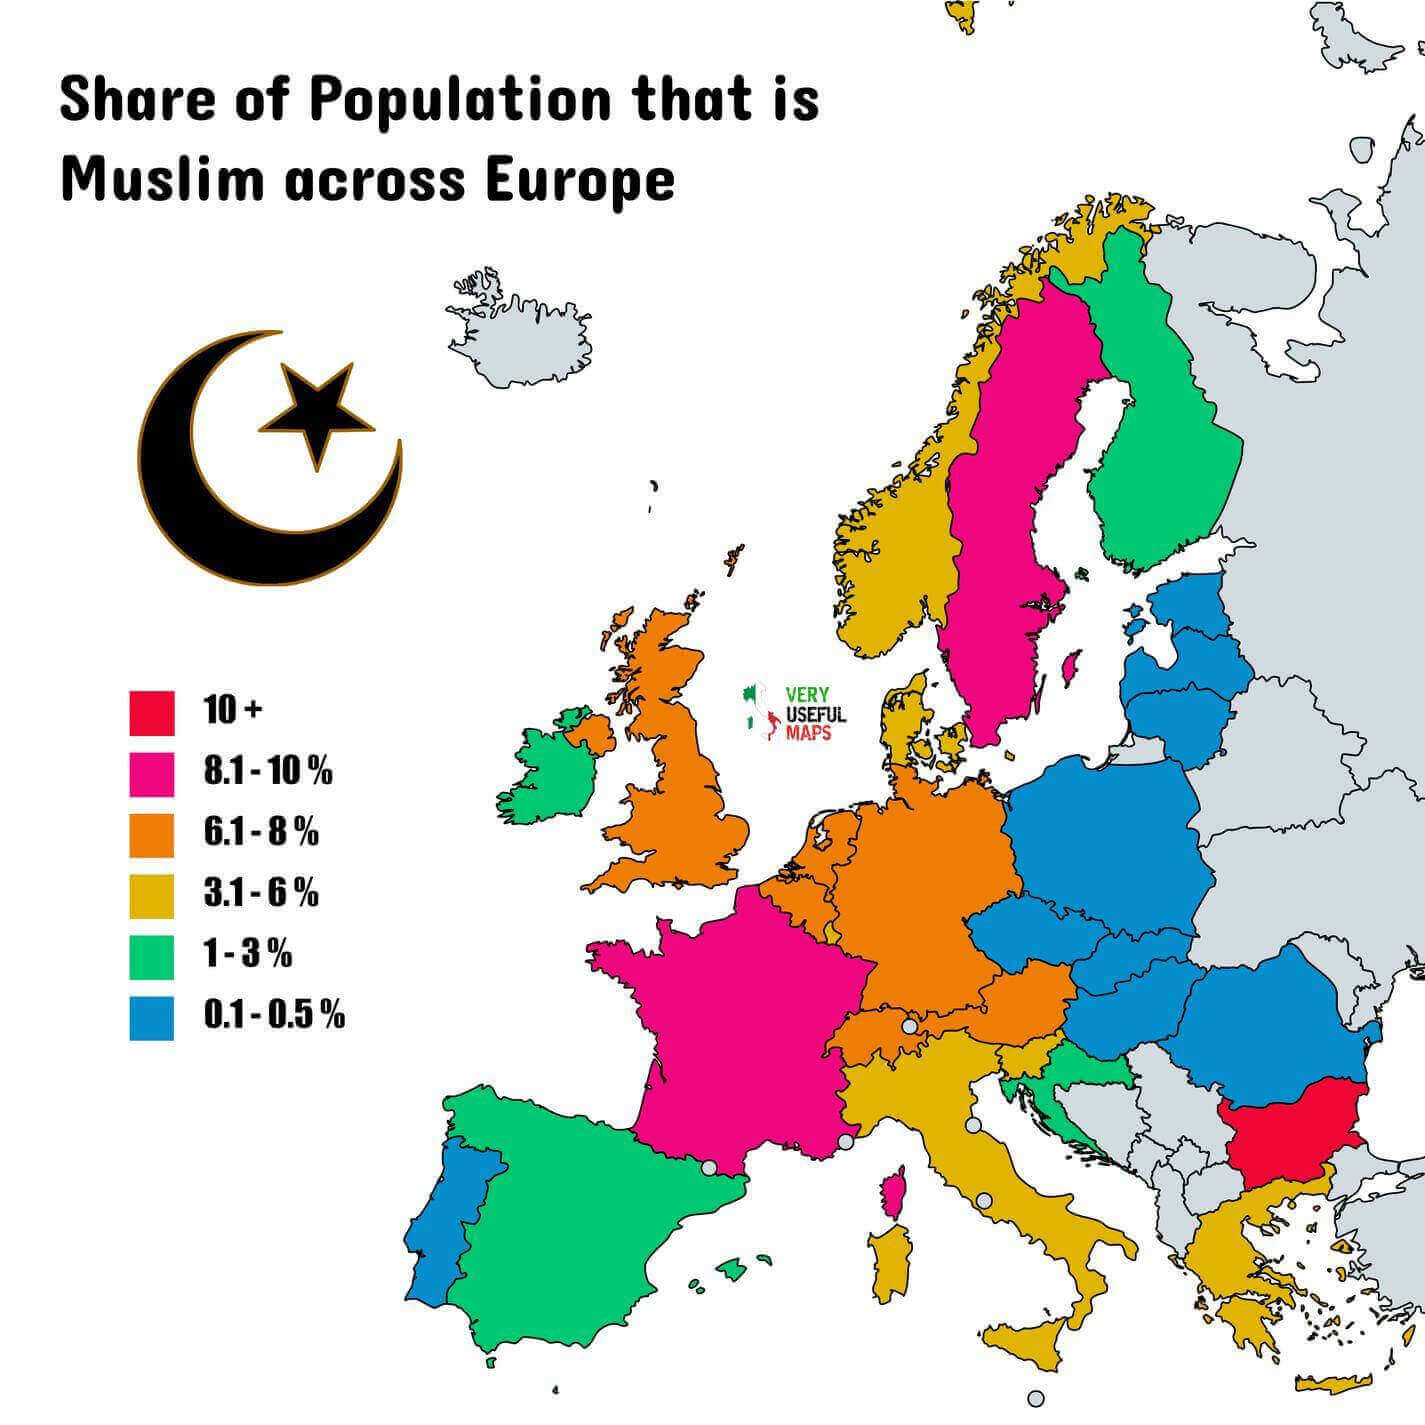
Europe Muslim Population Map (2016)
 Europe Muslim population map 2016 showing percentages and estimated sizes by country.
This map illustrates the distribution of the Muslim population across Europe in 2016, highlighting the percentage of Muslims in each country's population. Notable figures include 8.8% in France, 6.1% in Germany and 6.3% in the UK.
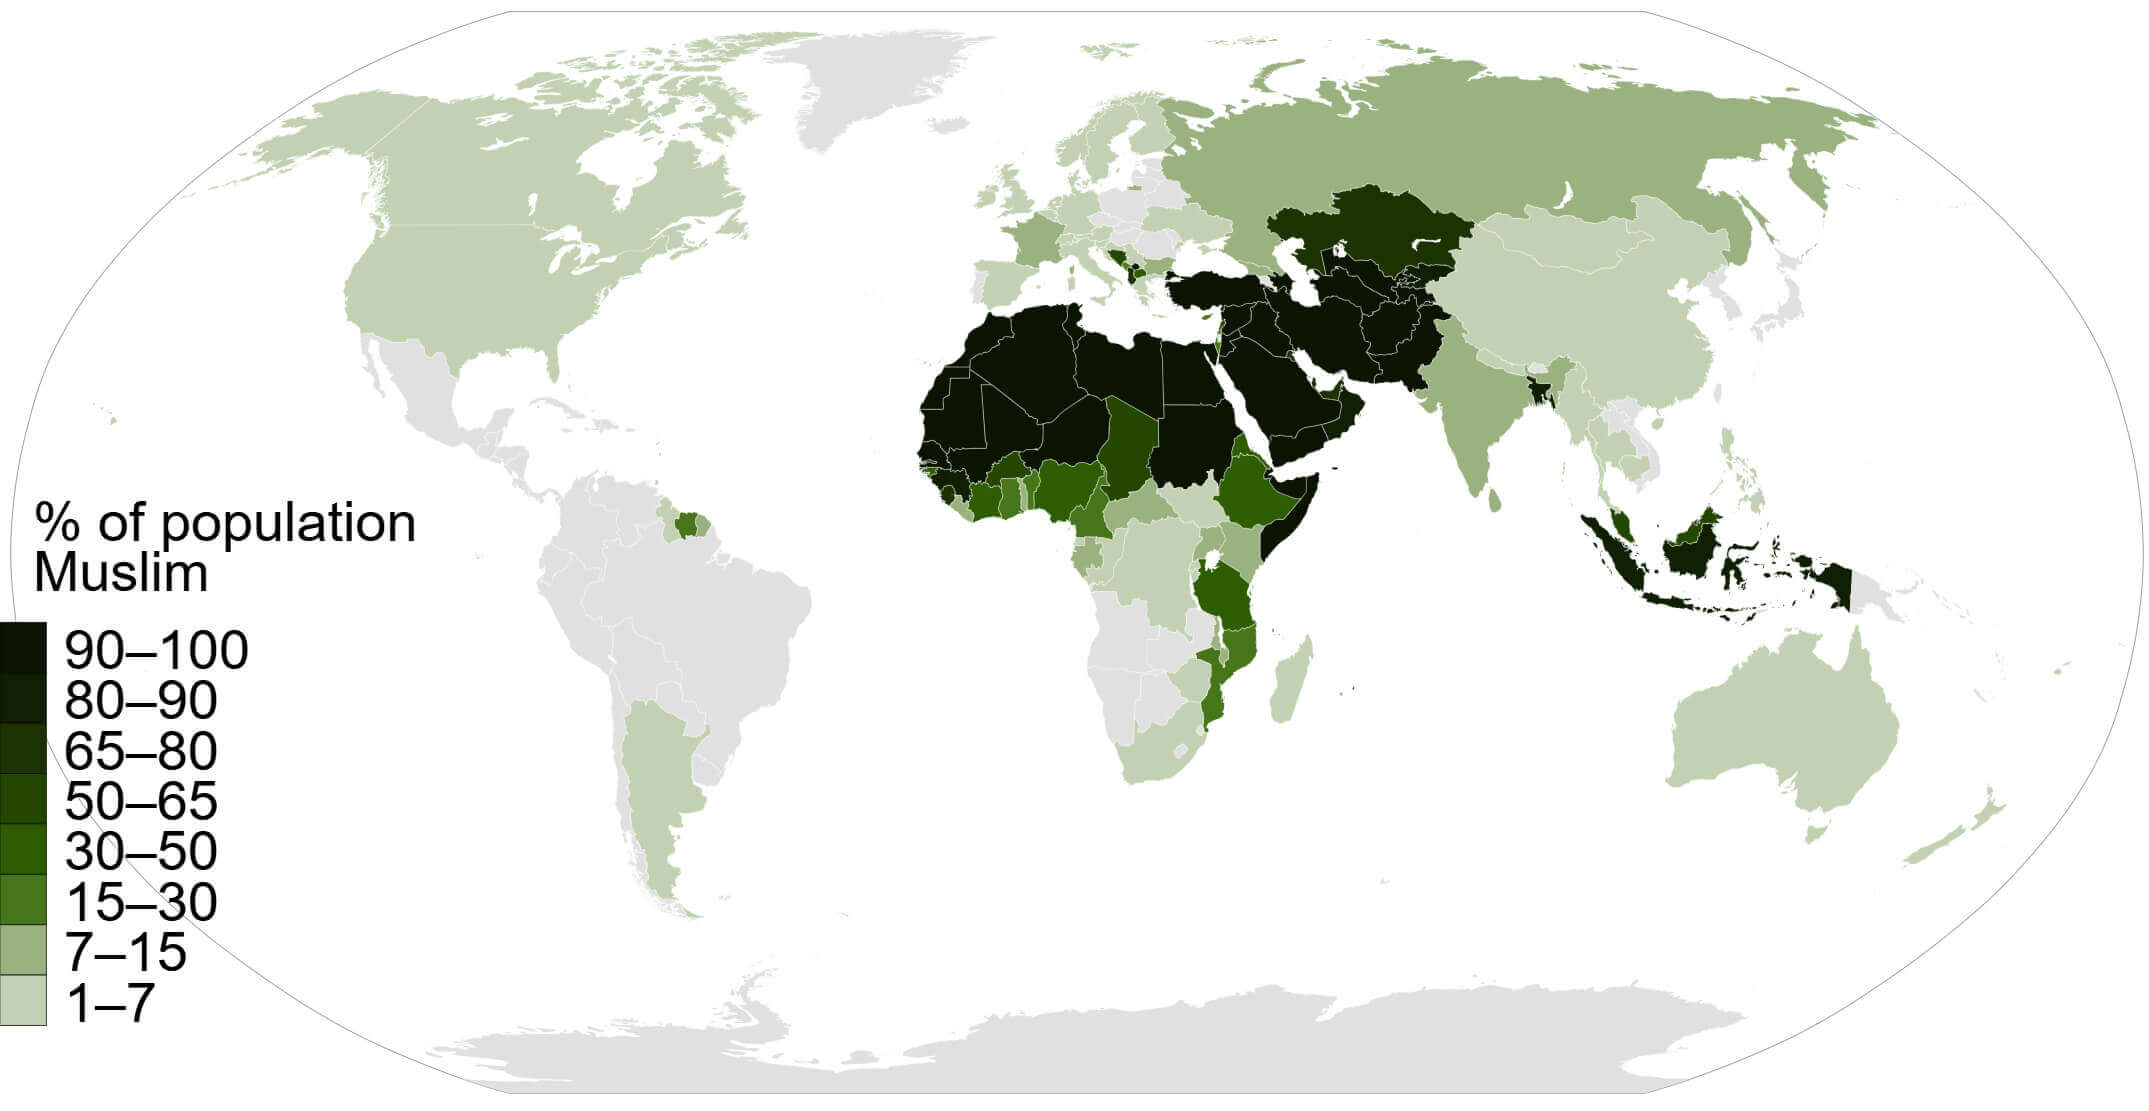
Europe Muslim population map in the World
Europe population desnity map in 2017
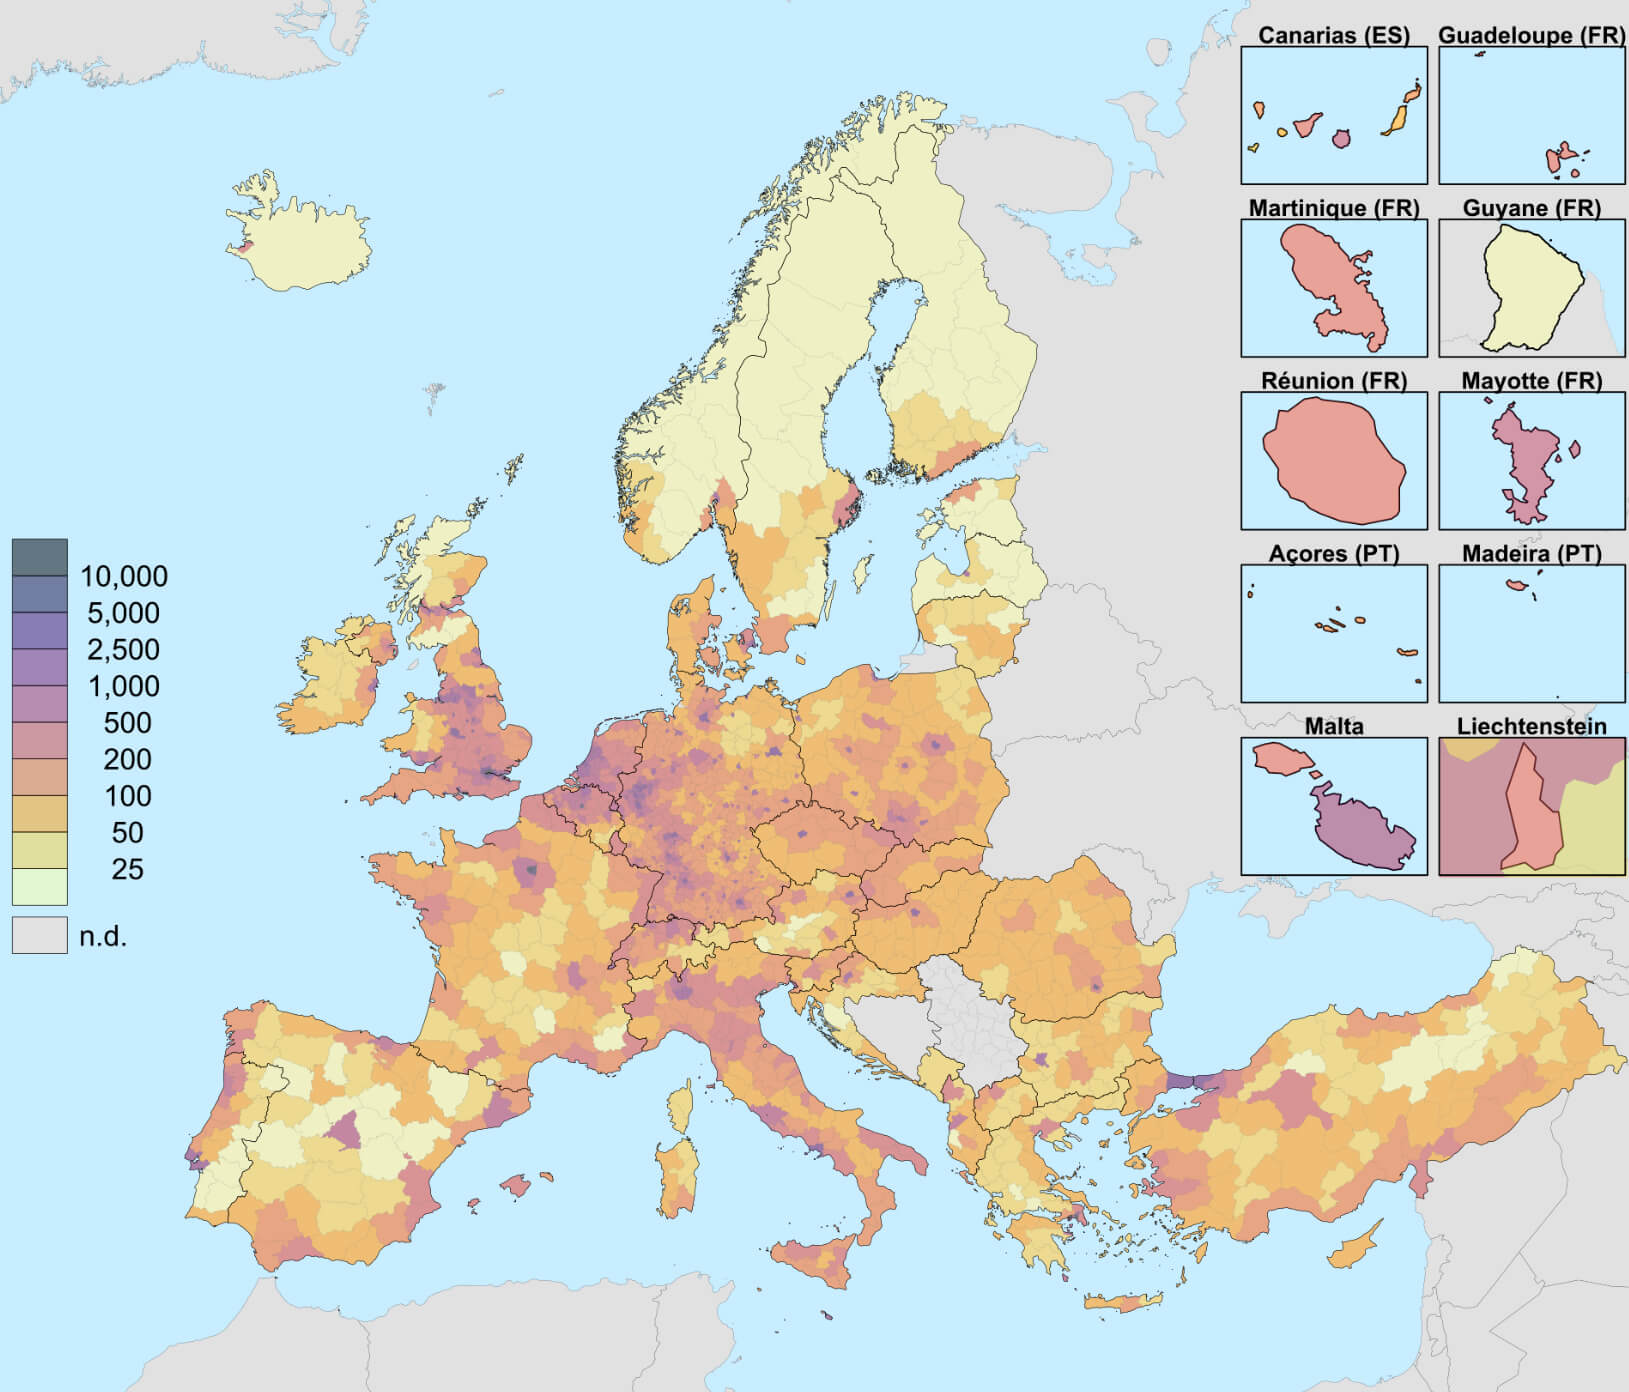
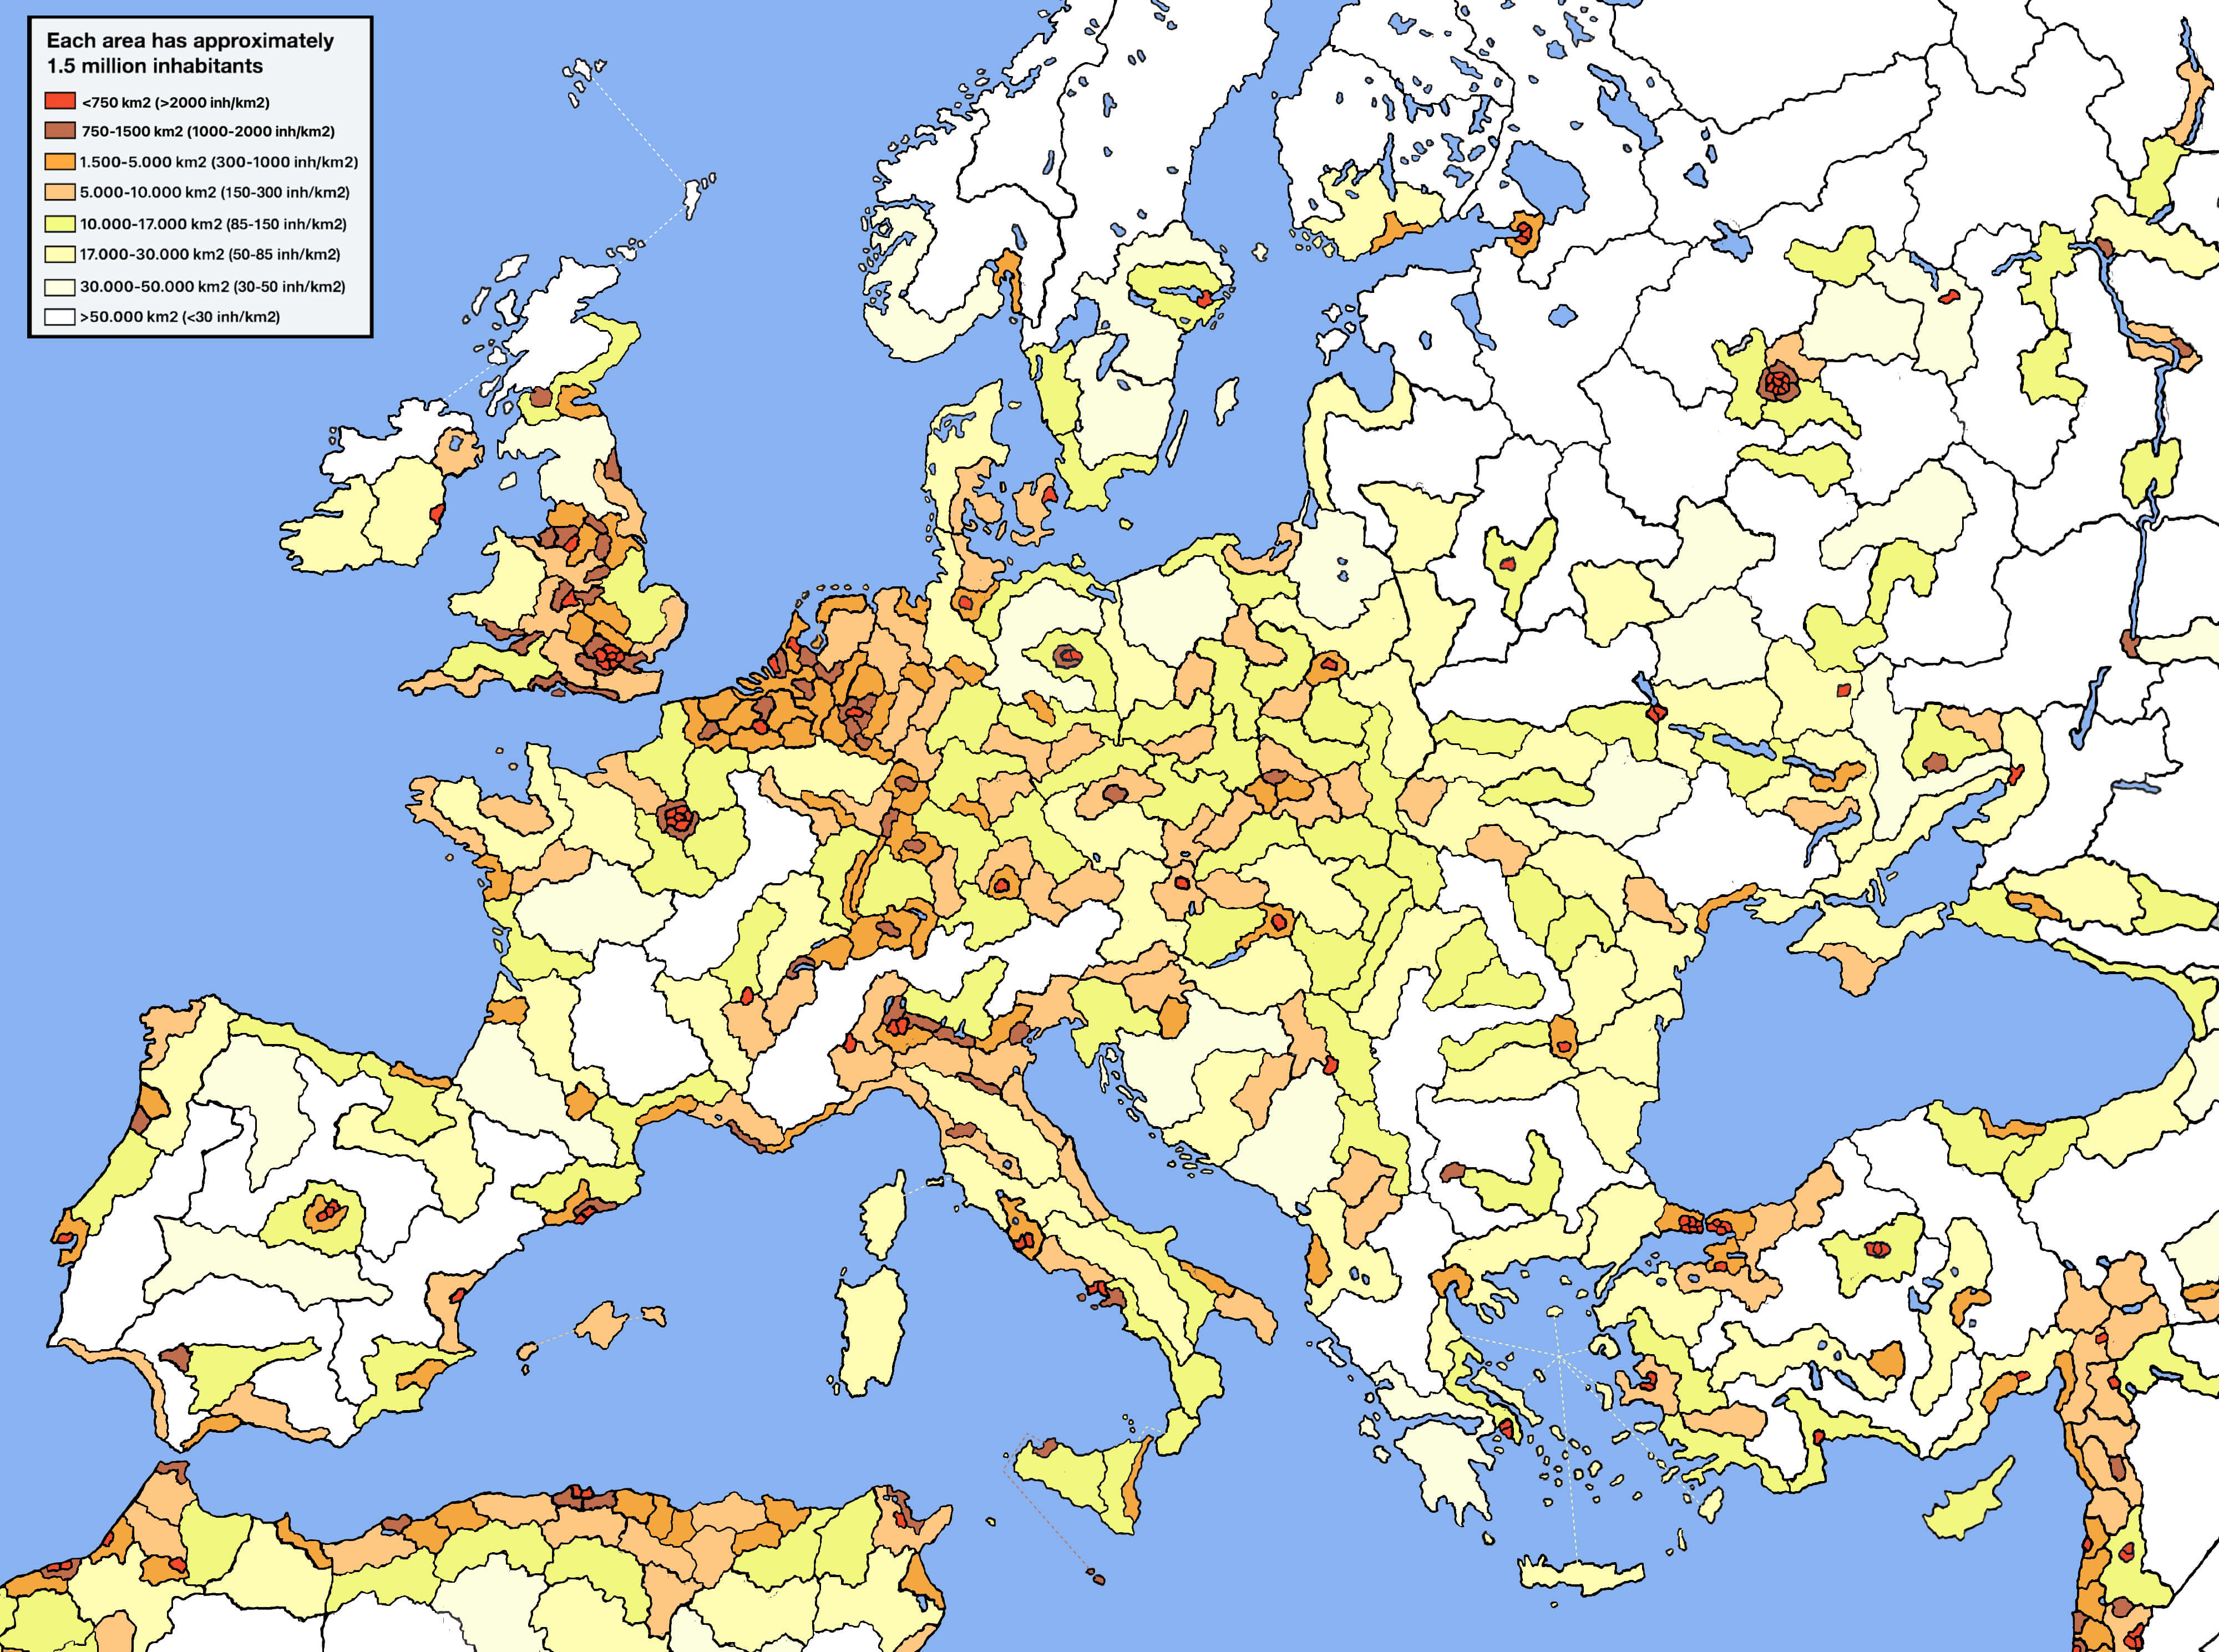
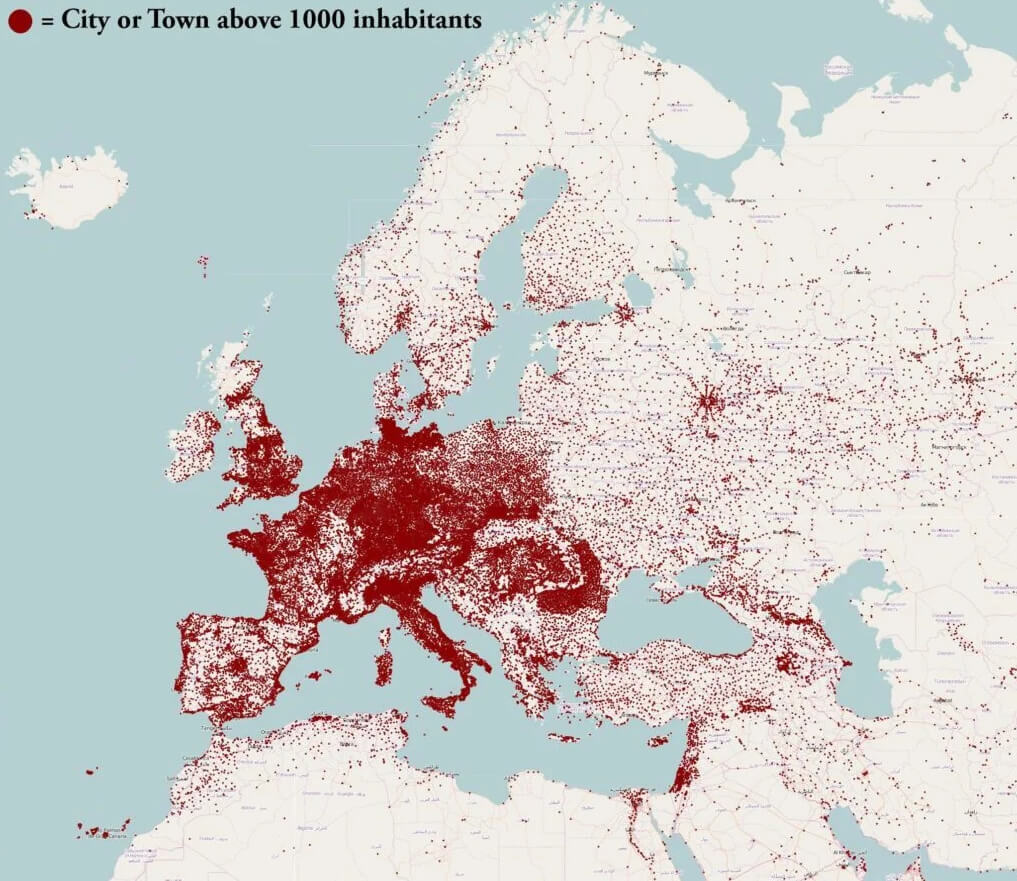
Europe Population Density Map
 Map showing population density across Europe, highlighting urban and sparsely populated areas.
This map illustrates population density in Europe, with darker red shades representing highly populated regions like London, Paris, and Moscow. Lighter areas indicate sparsely populated regions, emphasizing variations in population concentration across the continent.
Europe population map with inhabitants
Life Expectancy in EU - 2019
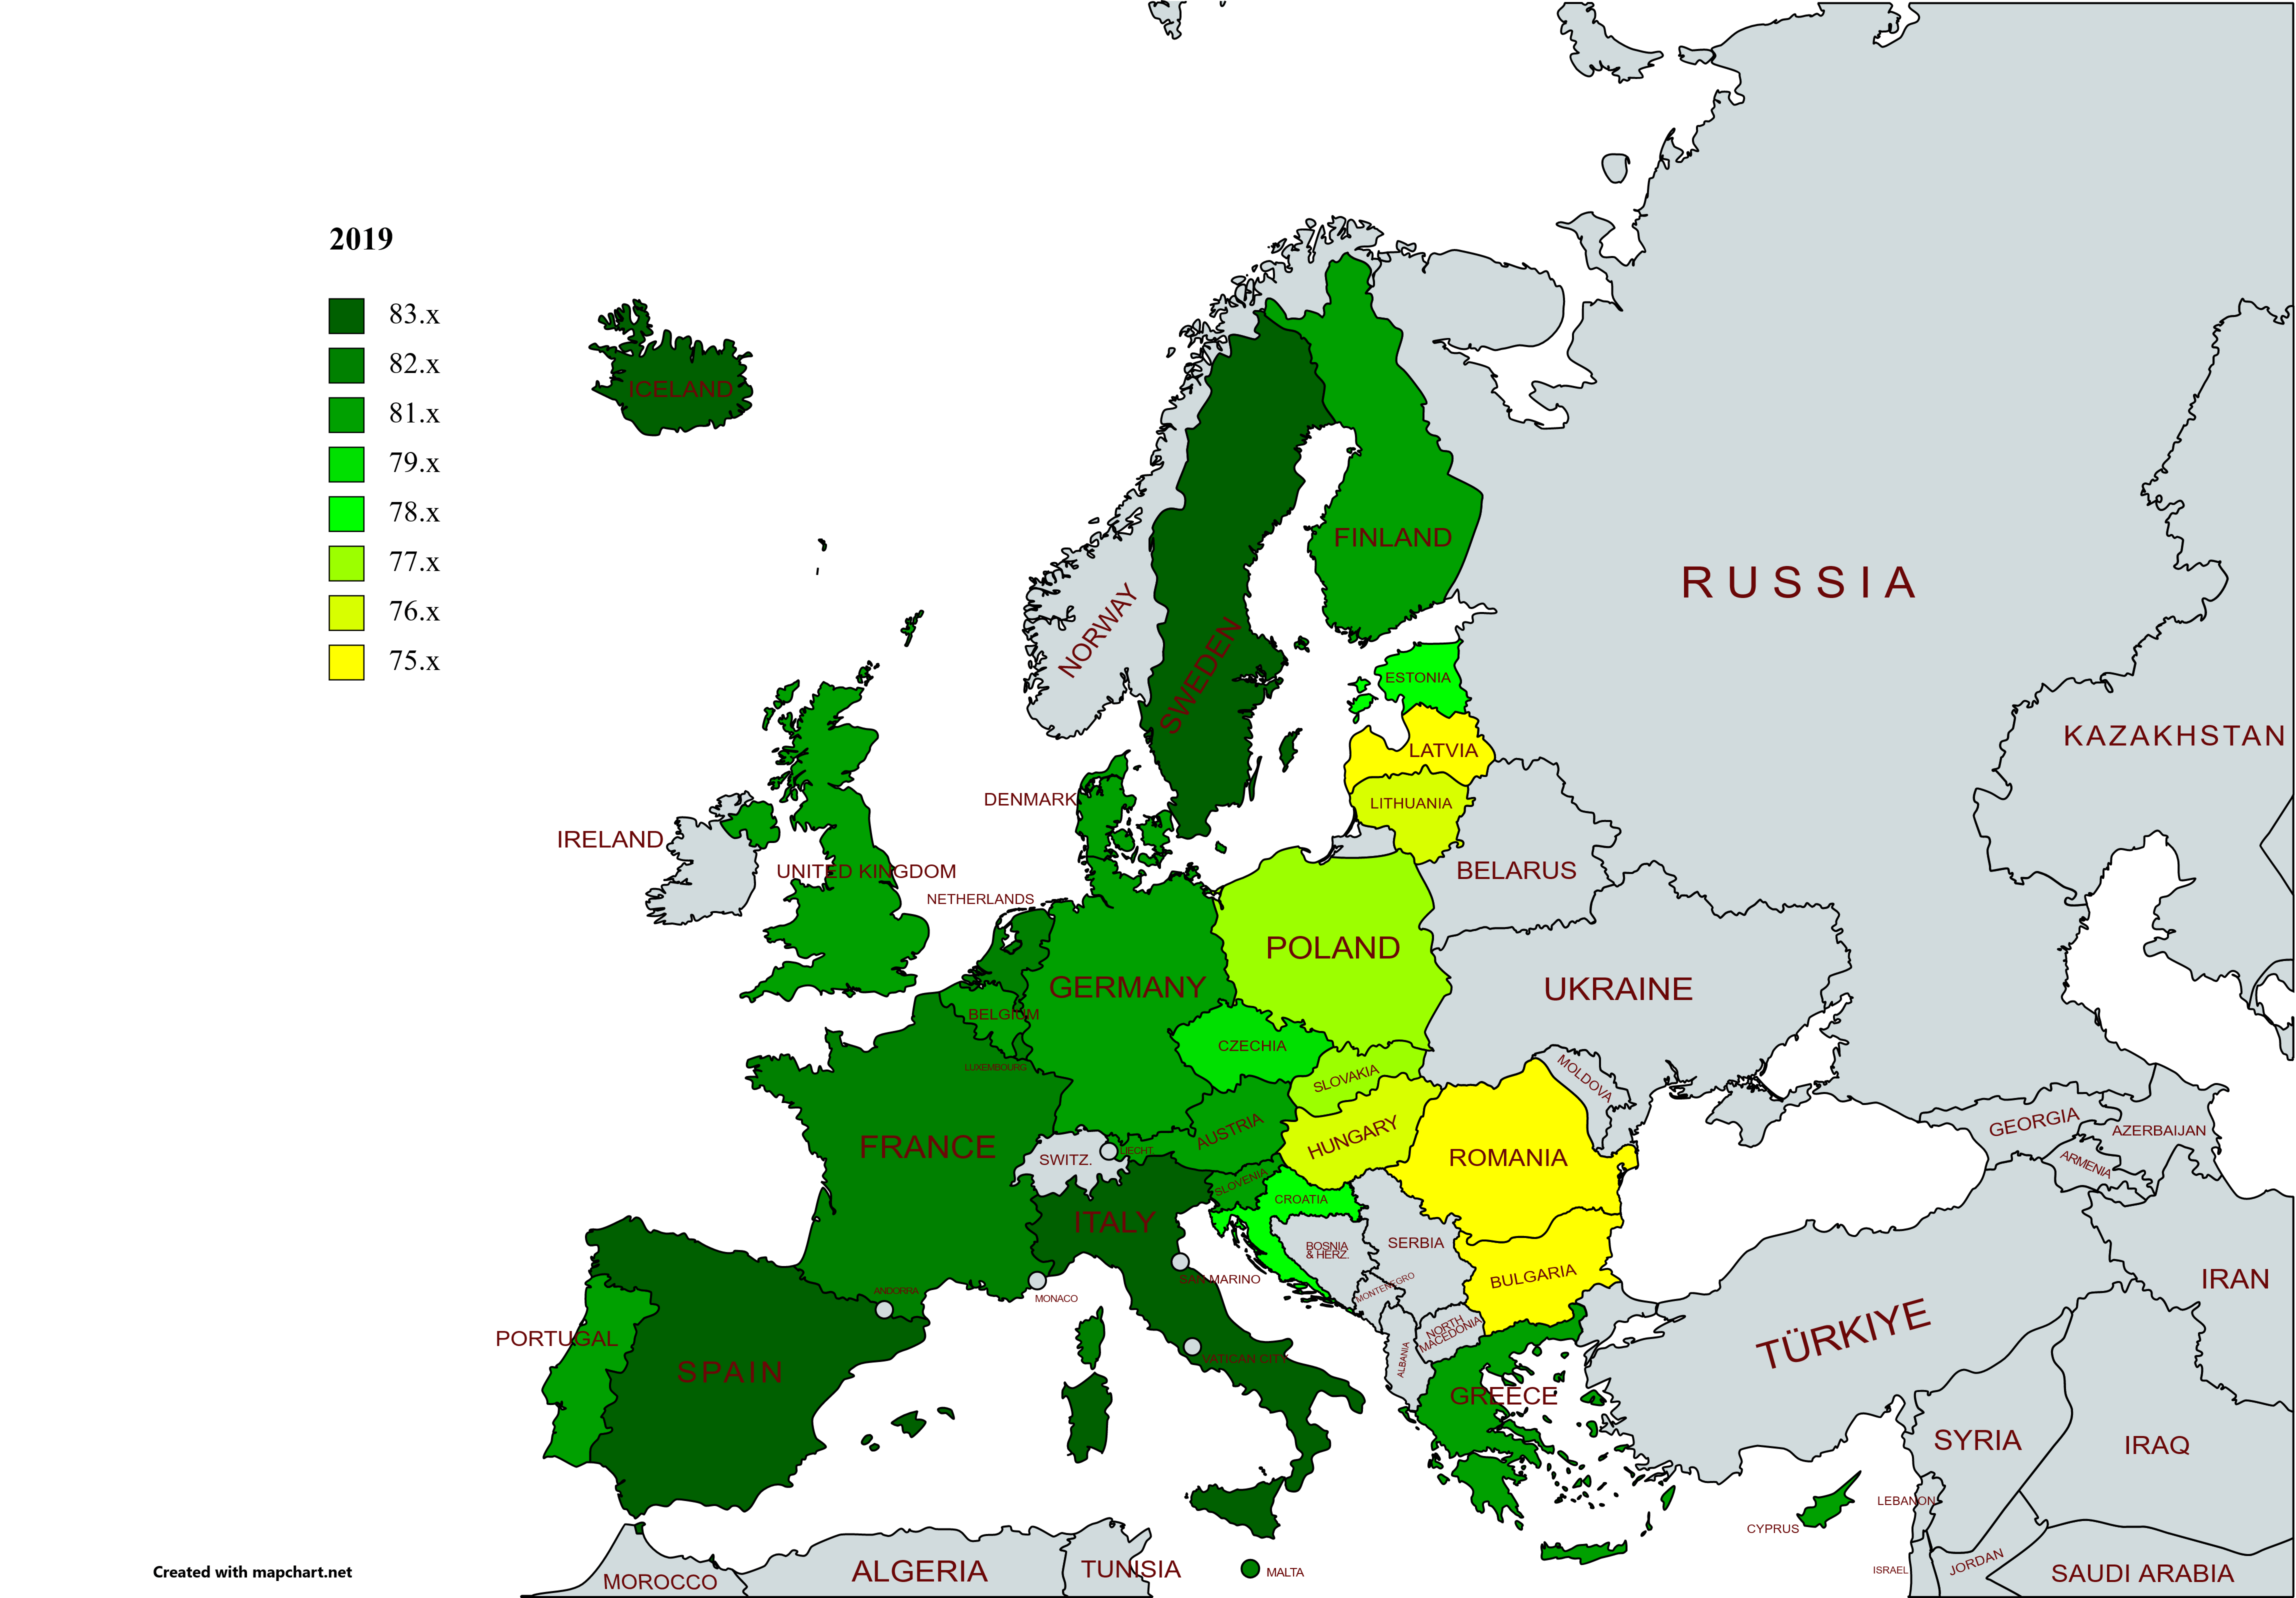 Map showing life expectancy across EU countries in 2019, with color-coded values
This map highlights the life expectancy across EU nations in 2019. Countries are color-coded from dark green (higher life expectancy) to yellow (lower life expectancy), showcasing disparities in health and longevity within the European Union.
Life Expectancy in EU - 2020
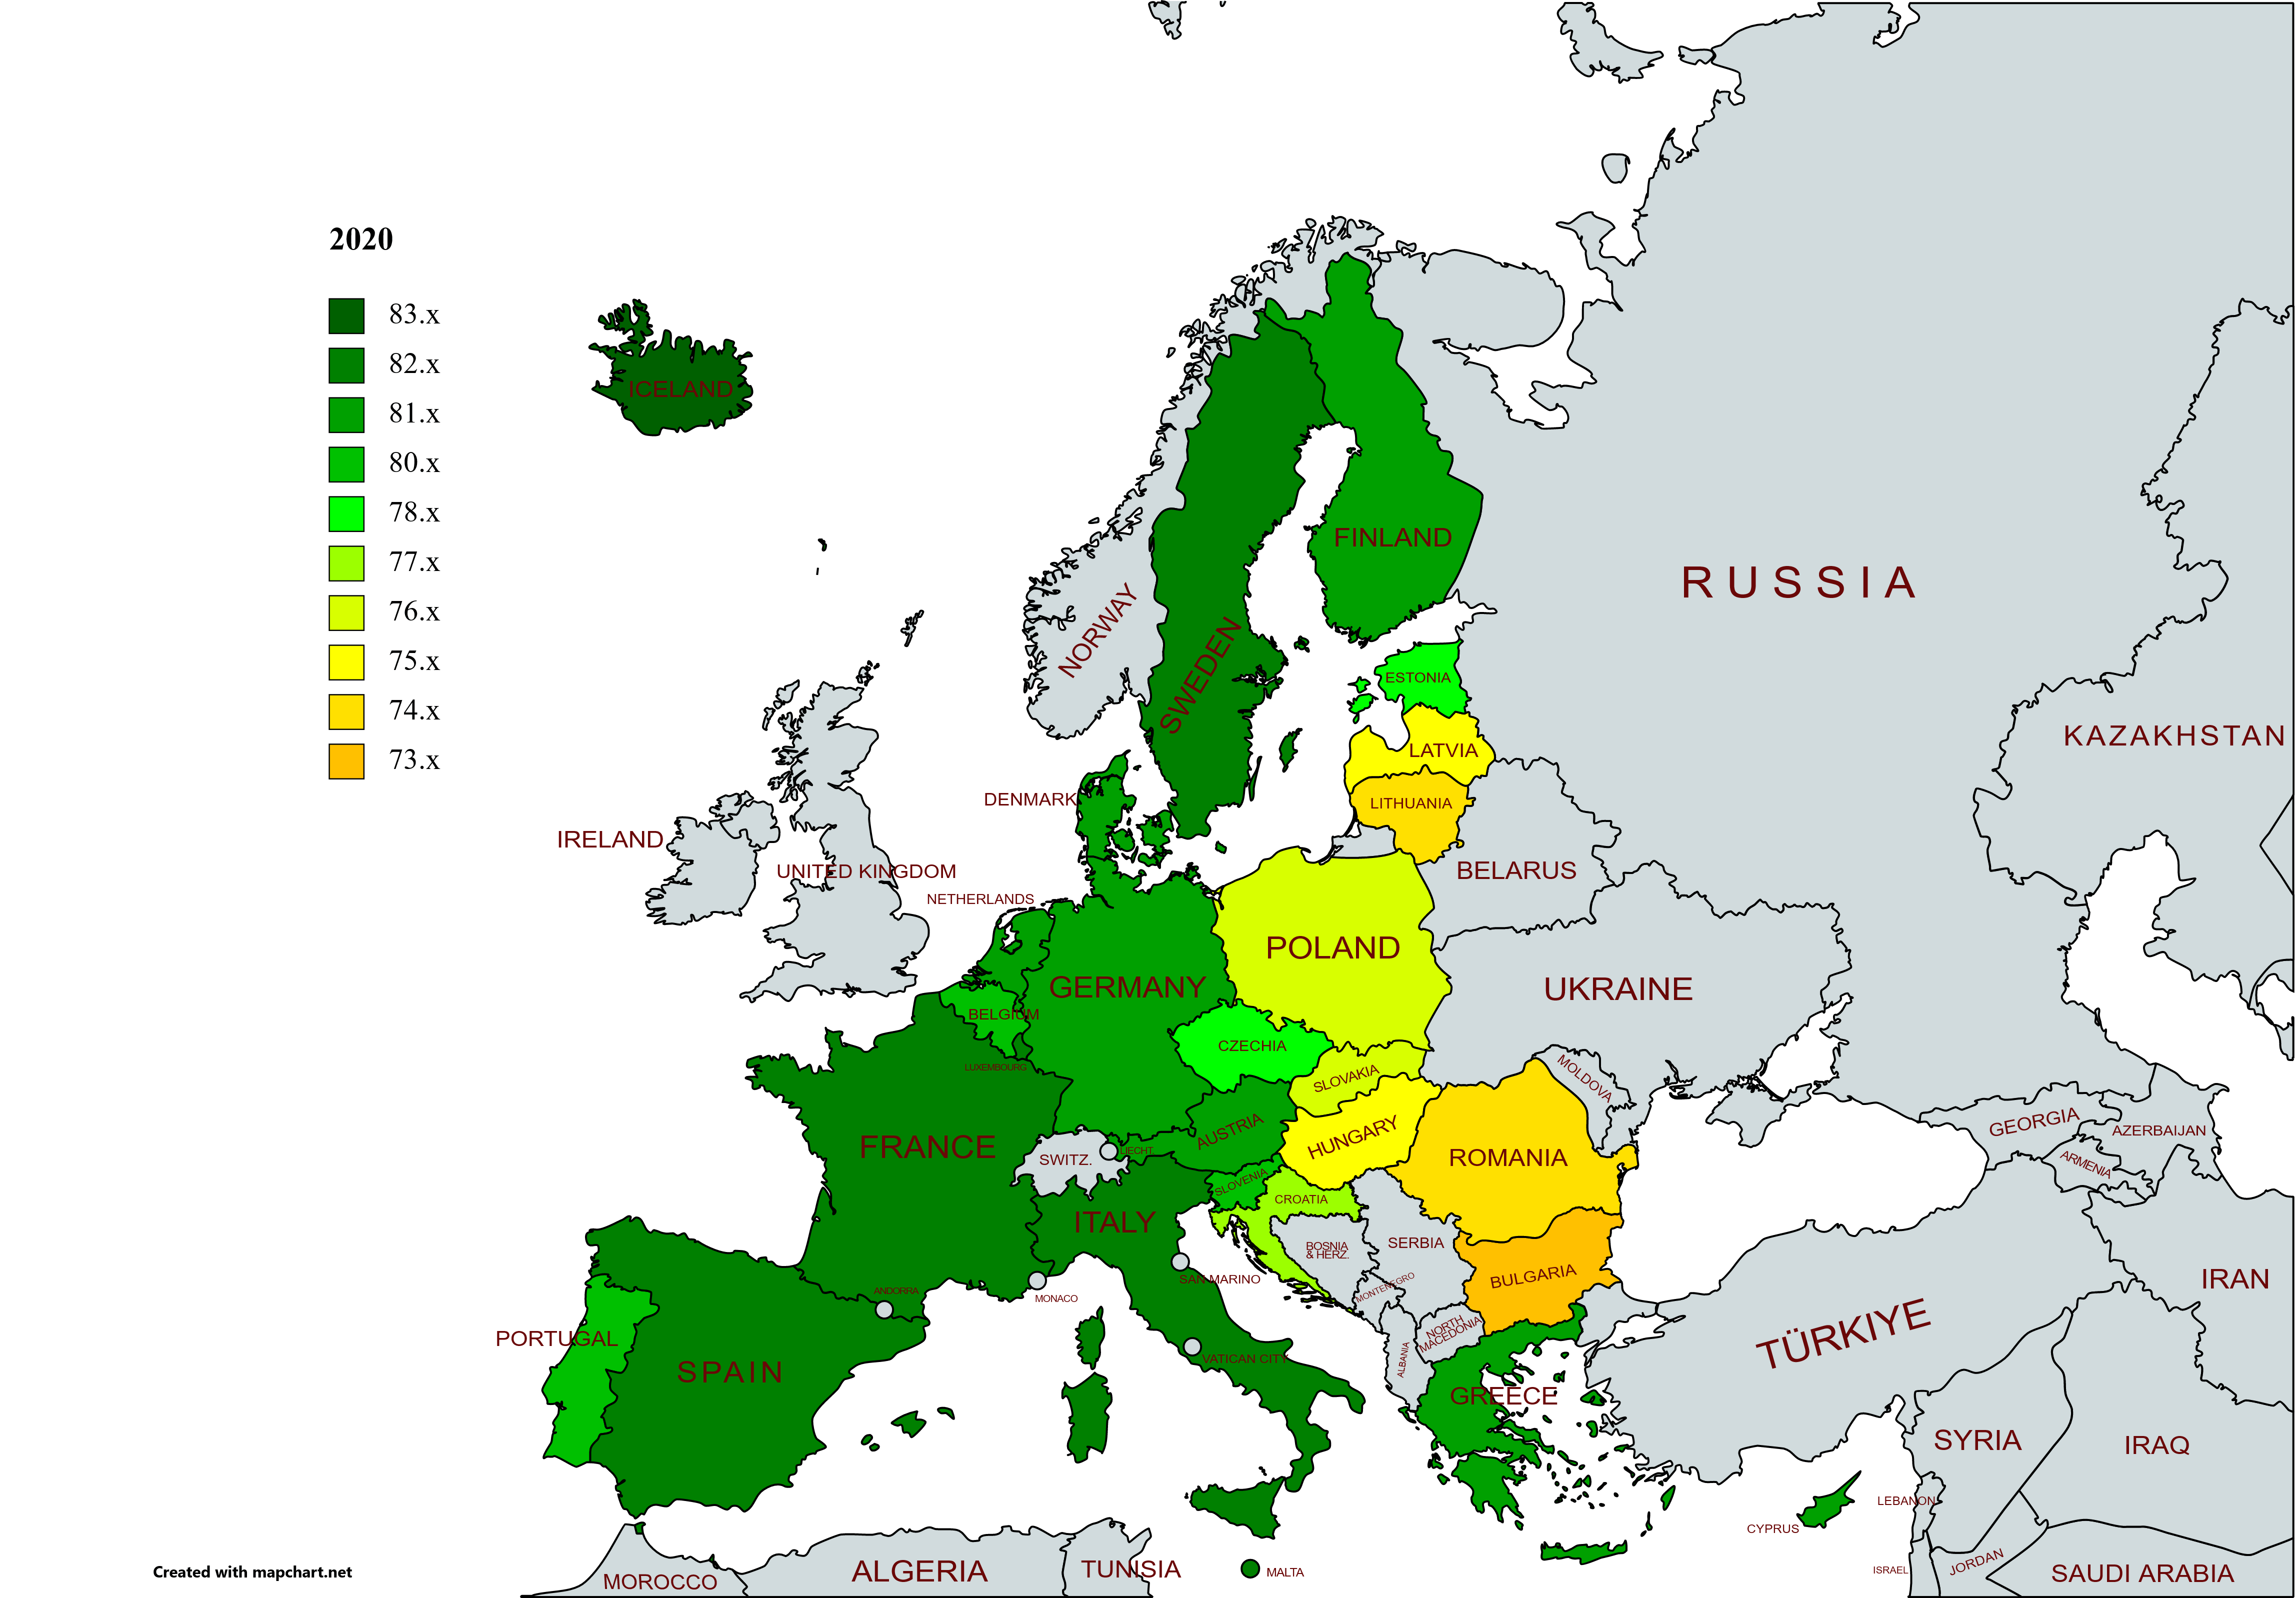 Map showing life expectancy across EU countries in 2020, with color-coded values
This map illustrates life expectancy in EU countries for 2020. The data is represented through a gradient of colors, from dark green (higher life expectancy) to yellow (lower life expectancy), showcasing the regional differences in health and longevity across Europe.
Life Expectancy in EU - 2021
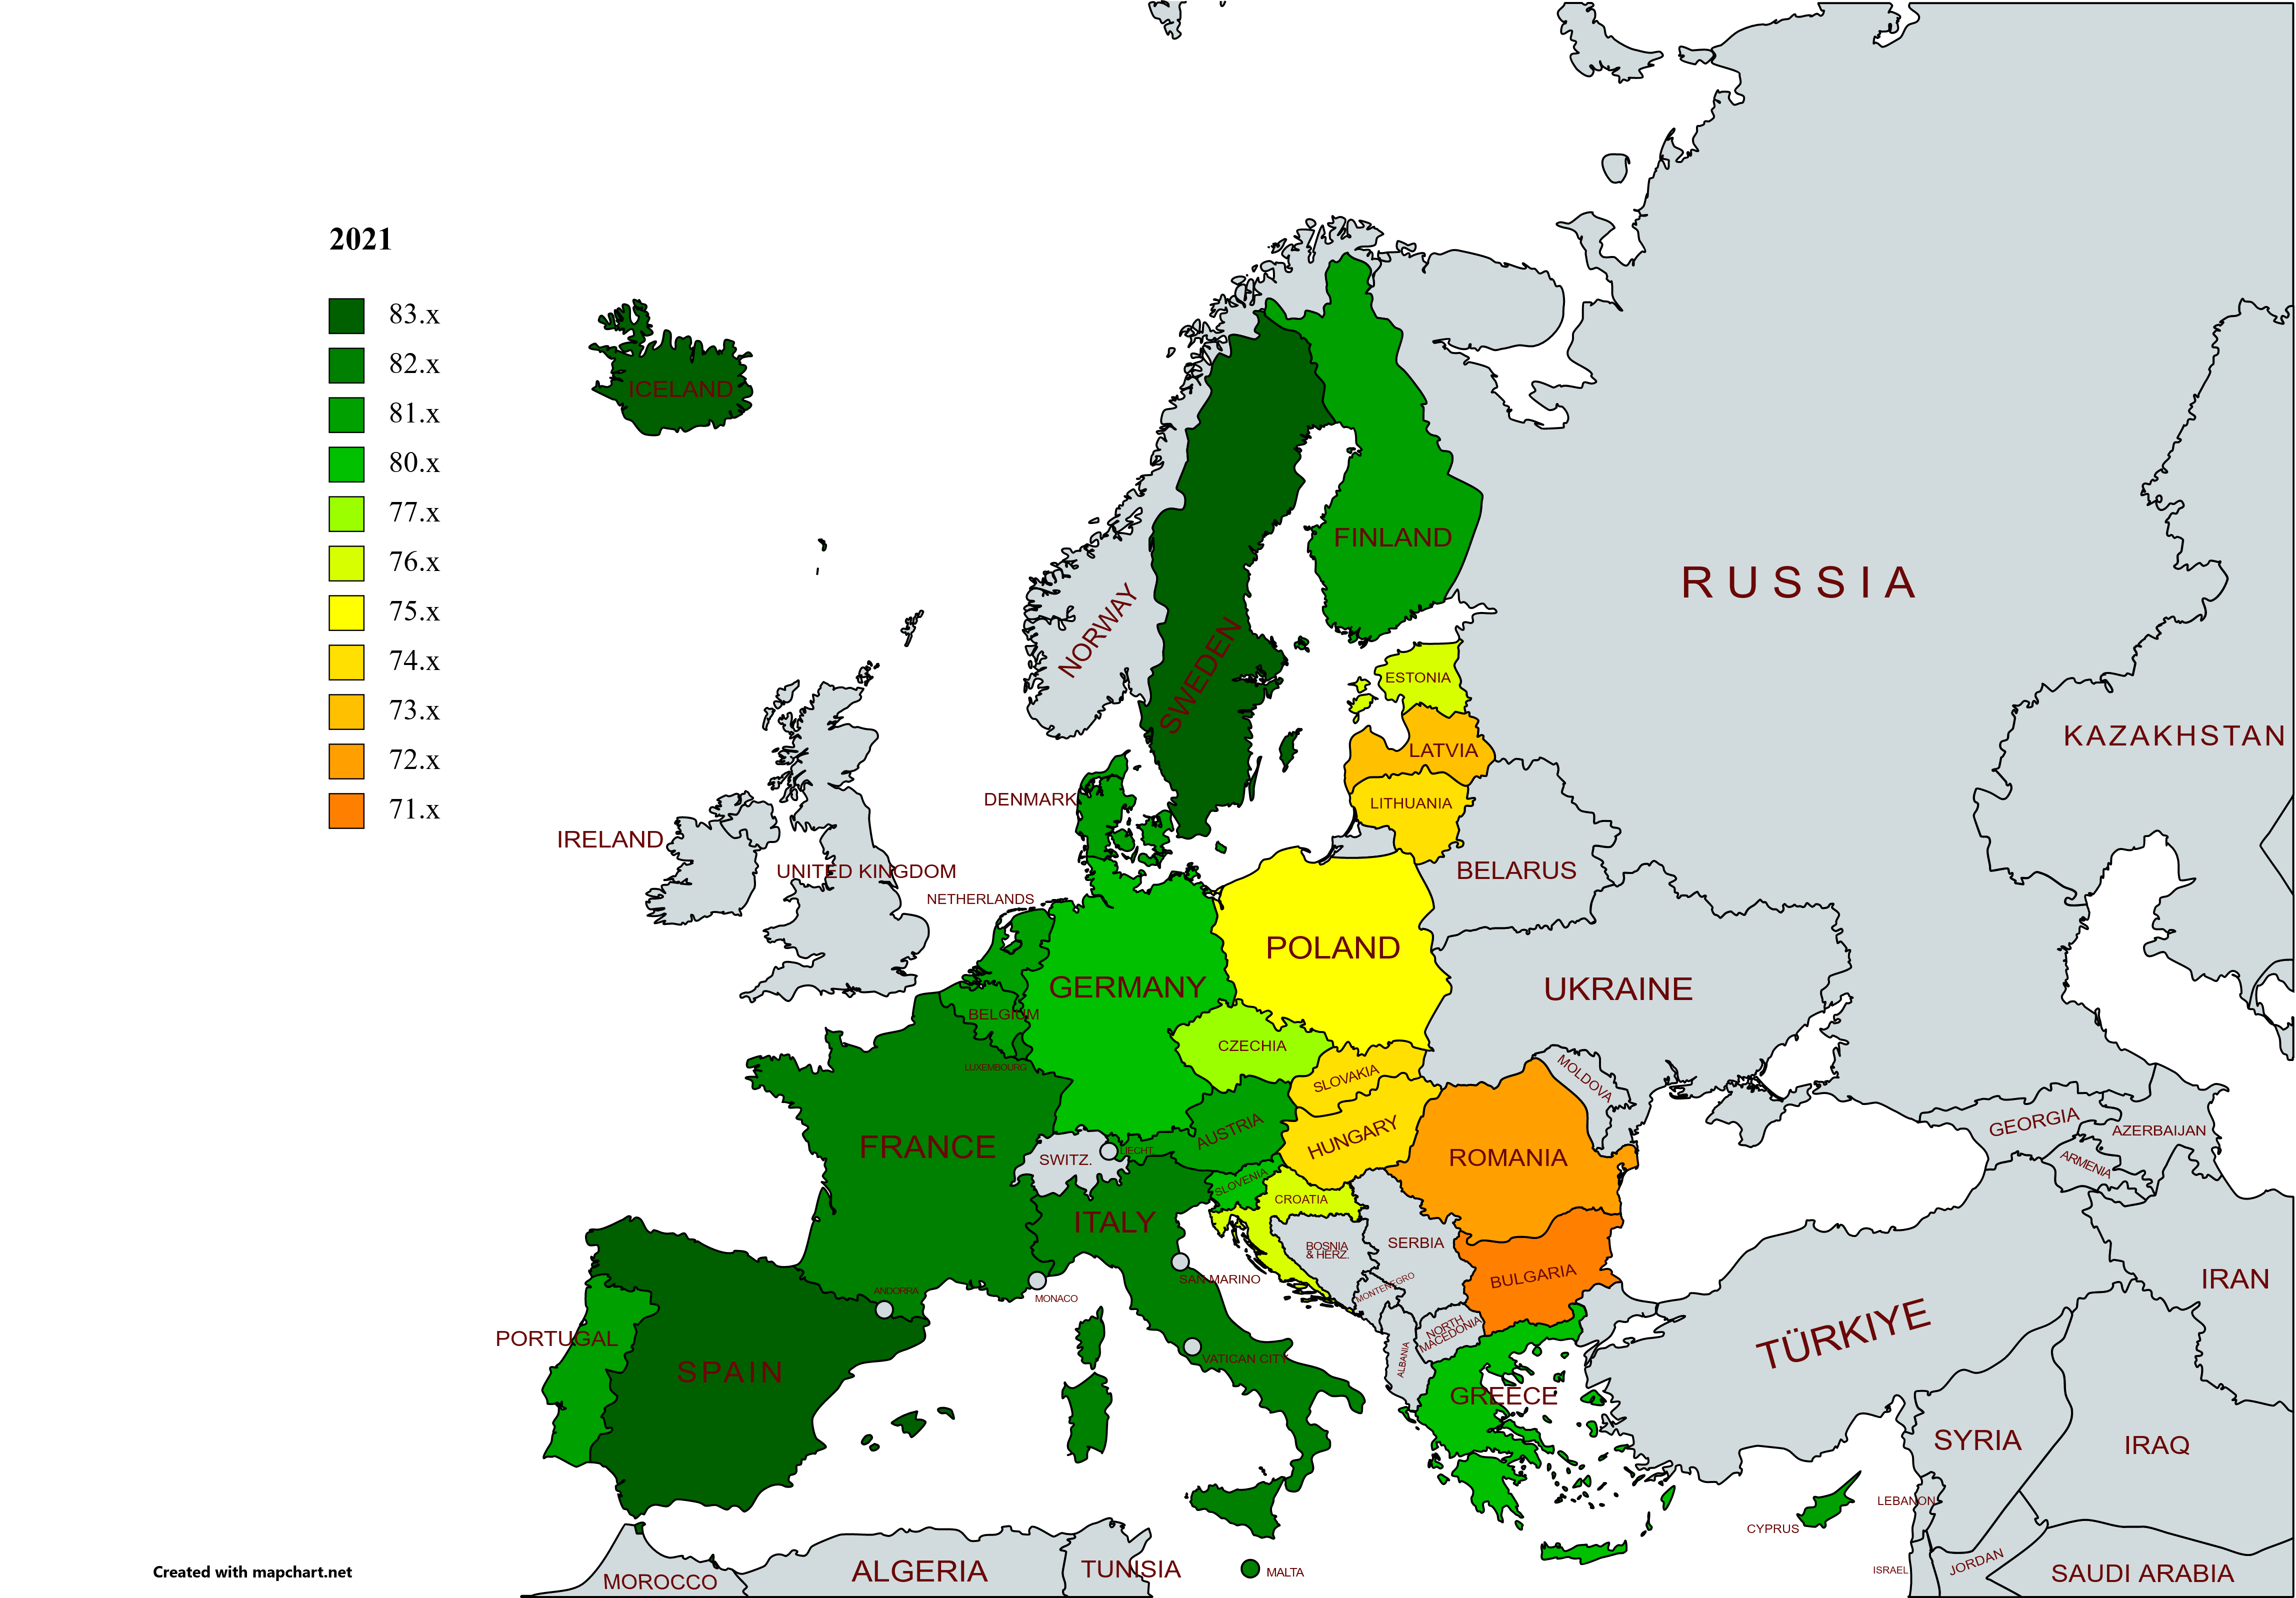 Map showing life expectancy across EU countries in 2021, with color-coded values
This map illustrates life expectancy in EU countries for 2021. The gradient color scheme highlights variations, ranging from dark green for the highest life expectancy to orange for the lowest, providing insights into health and longevity differences across the region.
Muslim population density map in Europe
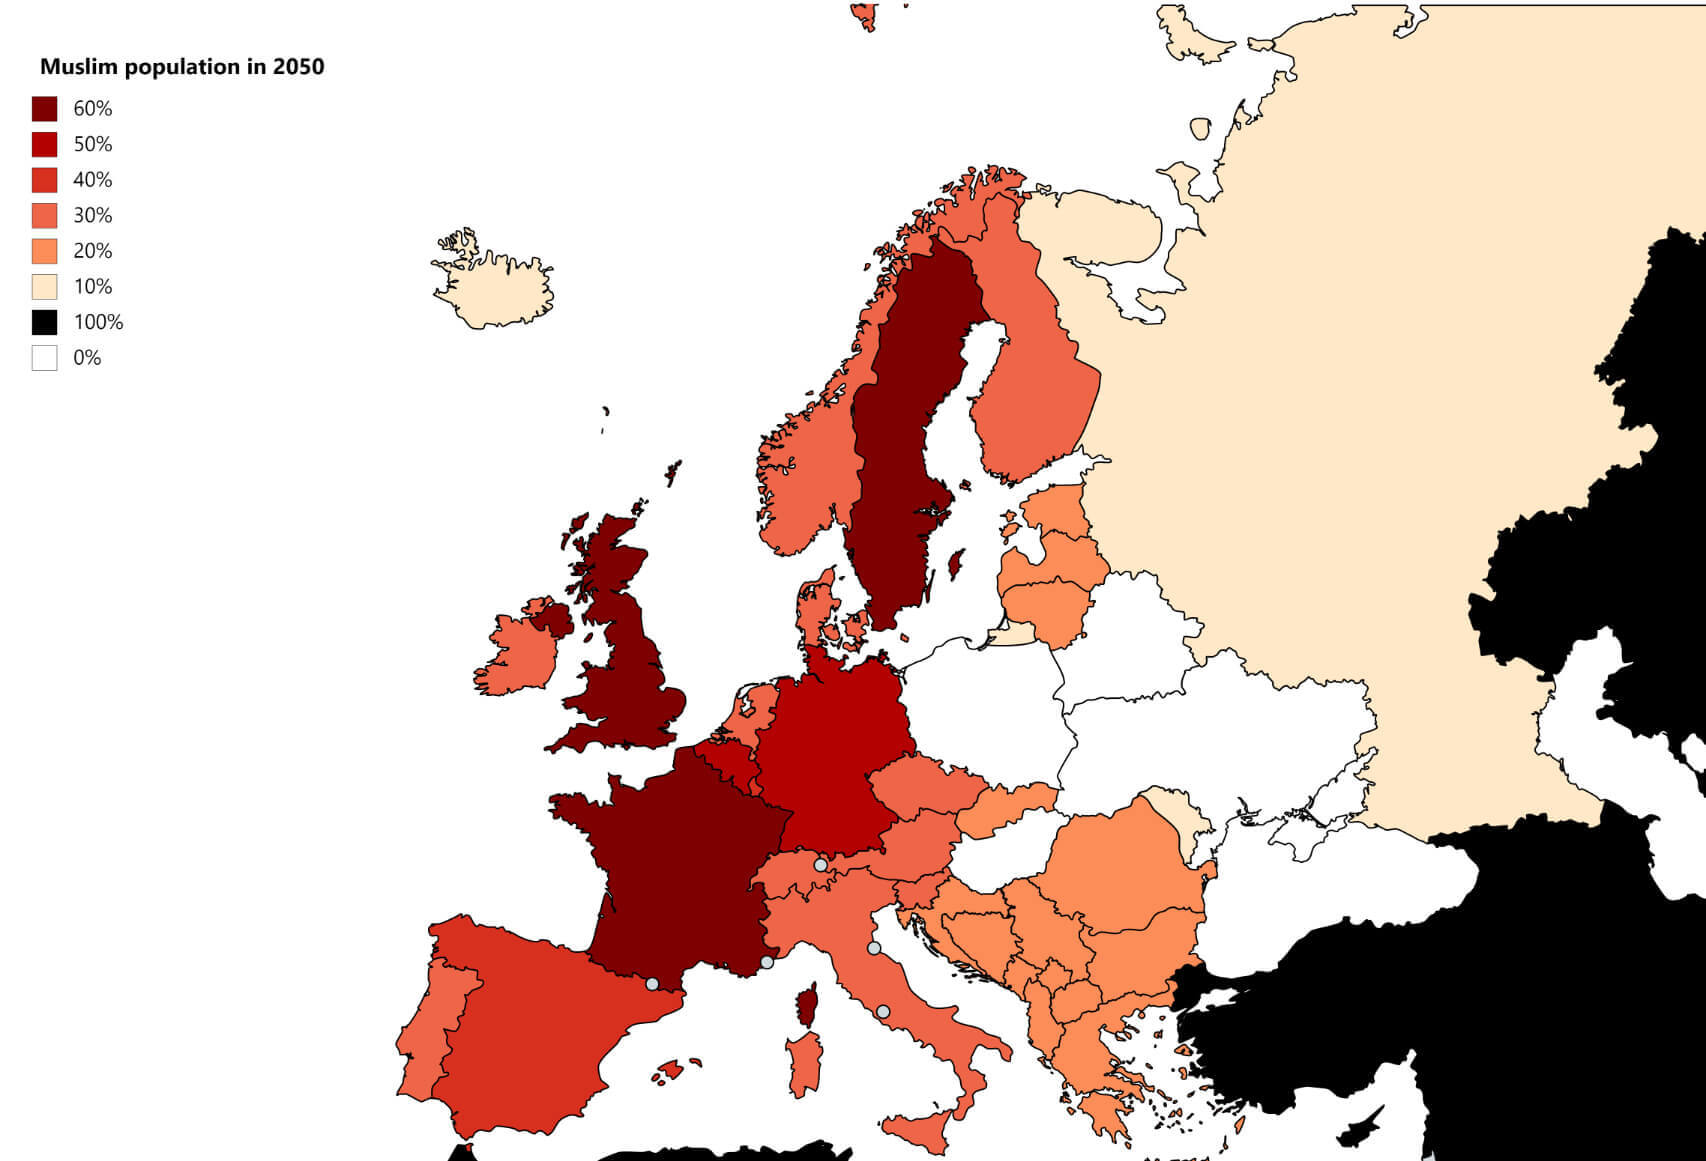
Muslim population growth map in Europe by 2050
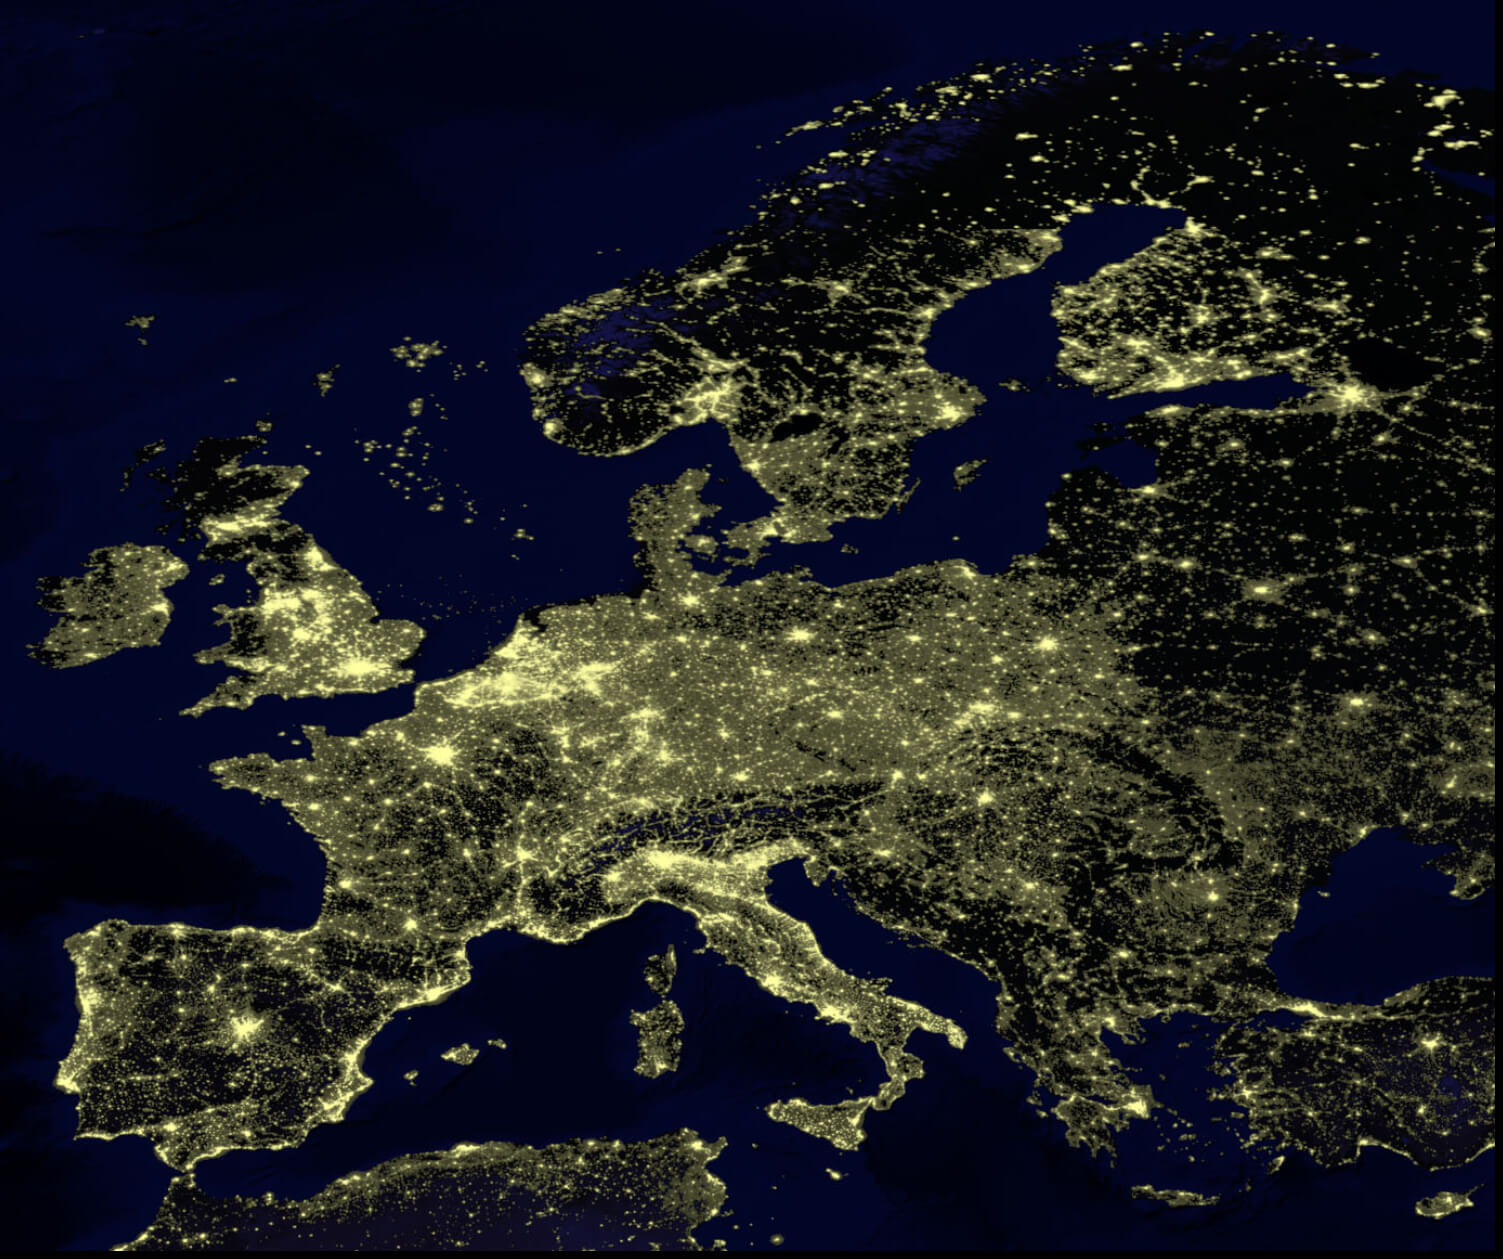
Population density map of the EU in the night
UK Muslim Population Map in the World
 Map of the world highlighting the United Kingdom's Muslim population in 2021.
This map displays the global distribution of Muslim populations, emphasizing the United Kingdom with a Muslim population of 2,130,000 in 2021. The color gradient reflects population sizes worldwide, showcasing the UK's demographic in a global context.
Western Europe population map